|
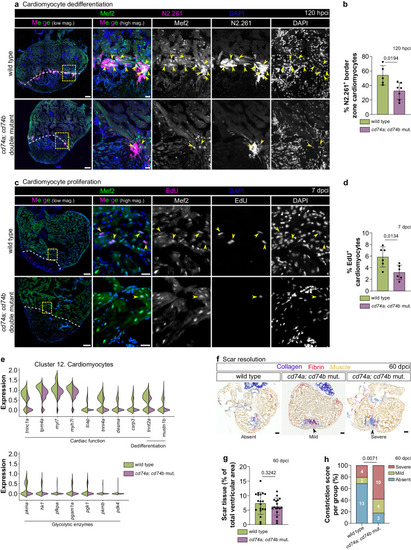
Cardiomyocyte regeneration is compromised in cd74a; cd74b mutants. a, b Images of representative cryosectioned adult zebrafish ventricles at 120 hpci, immunostained for Mef2 and N2.261 (a), showing dedifferentiating cardiomyocytes (yellow arrowheads), and respective quantification (b), showing a significant decrease in cd74a; cd74b mutants. c, d Images of representative cryosectioned ventricles from 7 dpci EdU-treated adult zebrafish, immunostained for Mef2 (c), showing proliferating cardiomyocytes (yellow arrowheads), and respective quantification (d), showing a decrease in cd74a; cd74b mutants. Yellow dashed rectangles outline the magnified areas; dashed lines mark the border of the injured tissue. e Violin plots of representative genes revealing an overall reduction in the expression of markers of cardiomyocyte function and dedifferentiation and of glycolytic enzymes in cd74a; cd74b mutant cardiomyocytes (cluster 12 from scRNA-seq in Fig. 6). Full list of differentially expressed genes and statistical information can be found in Supplementary Data 4. f Brightfield images of representative cryosectioned ventricles at 60 dpci, stained with AFOG, revealing the scar tissue by the collagen staining (blue) and tissue constrictions close to the injured tissue (arrowhead). g Quantification of scar size, showing no significant difference between wild type and cd74a; cd74b mutants. h Quantification of tissue constriction index, showing increased severity in cd74a; cd74b mutants compared with wild type. Scoring categories are exemplified in f. n = 19 wild types and 17 cd74a; cd74b mutants; the graph in h shows the percentage calculated based on the observed frequency; white numbers represent the counts per category. Dots in the bar graphs represent individual ventricles, and the bars represent the mean ± SD; n = 5 (wild type) and 7 (cd74a; cd74b mut.) biologically independent samples in (b) and 6 (wild type and cd74a; cd74b mut.) biologically independent samples in (d); two-tailed Welch’s t test (P values included in the graphs) in b, d, g; Fisher’s exact test in (h), using observed frequency values. Scale bars: 100 µm (low magnification); 20 µm (high magnification).
|