|
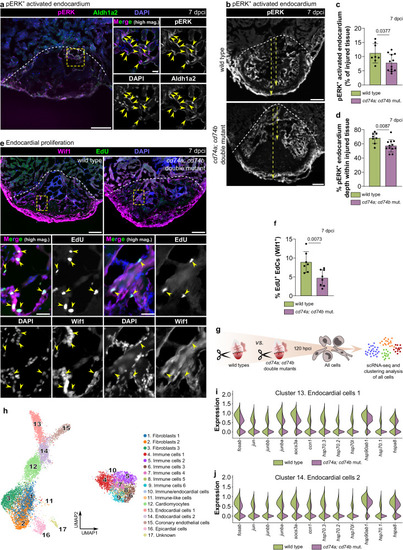
Endocardial regeneration is compromised in cd74a; cd74b mutants. a Confocal images of a representative cryosectioned adult zebrafish ventricle at 7 dpci, immunostained for pERK and Aldh1a2, showing pERK accumulation in EdCs (yellow arrowheads). Two independent experiments with similar results. b–d Confocal images of representative cryosectioned adult zebrafish ventricles at 7 dpci (c), and quantification of the percentage of pERK+ area within the injured tissue (c) and of the depth of pERK+ cells into the injured tissue (d), showing an overall reduction in cd74a; cd74b mutants compared with wild types. Yellow dashed arrows in (b) show the two distances measured to calculate the occupancy of pERK+ EdCs within the injured tissue quantified in (d). e, f Images of representative cryosectioned ventricles from 7 dpci EdU-treated adult zebrafish immunostained for Wif1 (e) and quantification of proliferating Wif1+ EdCs in the injured tissue (f; arrowheads in e). g Experimental design for scRNA-seq analysis of all cells from the border zone and injured tissue of wild types and cd74a; cd74b mutants at 120 hpci. h UMAP plot showing the clustering analysis of the scRNA-seq data containing all wild-type and cd74a; cd74b mutant cells. i, j Violin plots of representative genes revealing an overall reduction in the stress response of cd74a; cd74b mutant EdCs in both clusters 13 (i) and 14 (j). Full list of differentially expressed genes and statistical information can be found in Supplementary Data 3. Dots in the graphs represent individual ventricles, and the bars represent the mean ± SD; n = 8 (wild type) and 12 (cd74a; cd74b mut.) biologically independent samples in c, d and 7 (wild type) and 8 (cd74a; cd74b mut.) biologically independent samples in (f); two-tailed Welch’s t test (P values included in the graphs). Yellow dashed square and rectangles outline the magnified areas; dashed lines mark the border of the injured tissue. Scale bars: 100 µm (low magnification); 20 µm (high magnification).
|