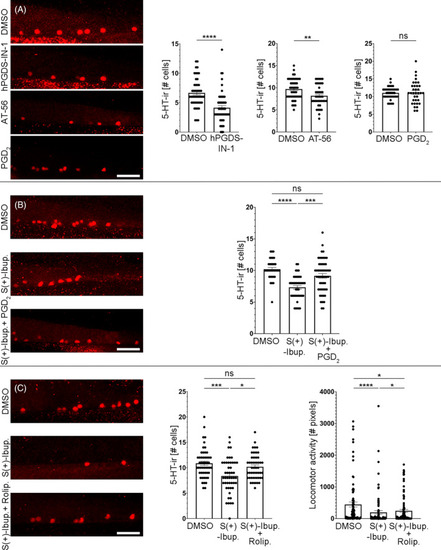
PGDS/PGD2/cAMP signalling promotes the generation of serotonergic neurons (red fluorescence) in the ventral spinal cord. (A) Treatments with the PGDS inhibitors hPGDS‐IN‐1 (4.132 ± 0.366 cells, n = 53; Mann–Whitney test; p‐value <0.0001) and AT‐56 (8.179 ± 0.392 cells, n = 39; Unpaired t‐test; p‐value = 0.0045) reduced the numbers of serotonergic neurons in the ventral spinal cord as compared to DMSO controls (hPGDS‐IN‐1 controls: 6.660 ± 0.359 cells, n = 47; AT‐56 controls: 9.696 ± 0.343 cells, n = 46). A treatment with PGD2 methyl ester (2.5 μM; 11.18 ± 0.546 cells, n = 34; Unpaired t‐test; p‐value = 0.8421) does not significantly change the number of serotonergic neurons in the spinal cord of 4 dpf zebrafish as compared to DMSO controls (11.06 ± 0.282 cells, n = 36). (B) A co‐treatment of S(+)‐Ibuprofen (10 μM) with 2.5 μM PGD2 methyl ester (9.154 ± 0.364 cells, n = 52; Kruskal–Wallis test; p‐value = 0.071) was able to rescue the inhibitory effects of an S(+)‐Ibuprofen treatment (7.333 ± 0.295 cells, n = 42; Kruskal–Wallis test; p‐value <0.0001) on the generation of 5‐HT‐ir spinal cord neurons. Numbers of serotonergic neurons in S(+)‐Ibuprofen and PGD2 methyl ester treated zebrafish were not significantly different as compared to DMSO controls (10.21 ± 0.283 cells, n = 34). C. S(+)‐Ibuprofen and Rolipram treated 4 dpf zebrafish showed numbers of 5‐HT‐ir neurons (10.19 ± 0.361 cells, n = 47; Kruskal–Wallis test; p‐value = 0.9081) similar to DMSO controls (10.88 ± 0.411 cells, n = 50) and that were significantly higher than S(+)‐Ibuprofen treated (8.375 ± 0.489 cells, n = 48; Kruskal–Wallis test; p‐value = 0.0006) zebrafish. 4 dpf zebrafish treated with S(+)‐Ibuprofen and Rolipram (245.3 ± 45.66 cm, n = 89; Kruskal–Wallis test; p‐value = 0.0315) showed increased locomotor activity as compared to S(+)‐Ibuprofen (198.7 ± 56.07 cm, n = 88; Kruskal–Wallis test; p‐value <0.0001) treated zebrafish (Figure 3D). However, locomotor activity in S(+)‐Ibuprofen and Rolipram treated zebrafish was still significantly lower than in DMSO controls (445.2 ± 79.30 cm, n = 85). Rostral is to the right and dorsal to the top in all photomicrographs. Scale bars: 25 μm.
|
