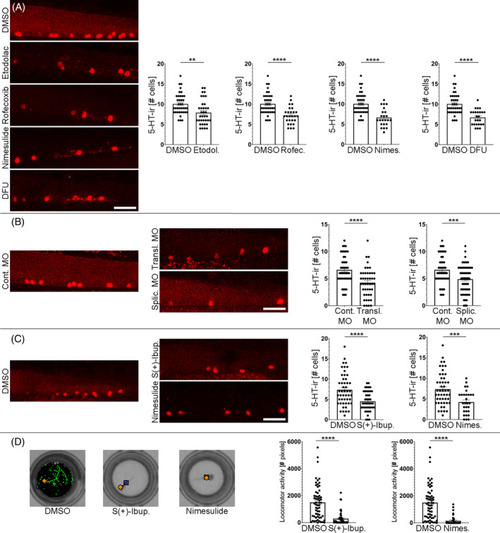
COX2 (ptgs2a) inhibition reduces the numbers of serotonergic neurons (red fluorescence) in the ventral spinal cord and leads to locomotor deficits. (A) Treatments with the selective COX2 inhibitors Etodolac (7.917 ± 0.499 cells, n = 36; Unpaired t‐test; p‐value = 0.0017), Rofecoxib (7.185 ± 0.403 cells, n = 27; Unpaired t‐test; p‐value <0.0001), Nimesulide (6.652 ± 0.46 cells, n = 23; Unpaired t‐test; p‐value <0.0001) and DFU (6.72 ± 0.38 cells, n = 25; Unpaired t‐test; p‐value <0.0001) reduced the numbers of serotonergic neurons in the ventral spinal cord as compared to DMSO controls (10.05 ± 0.424 cells, n = 38). (B) Translation (4.244 ± 0.395 cells, n = 45; Unpaired t‐test; p‐value = 0.0007) and splicing (4.881 ± 0.338 cells, n = 59; Unpaired t‐test; p‐value = 0.0015) morpholinos (MO) against the ptgs2a mRNA reduced the numbers of serotonergic neurons in the ventral spinal cord as compared to zebrafish treated with the control morpholino (6.250 ± 0.411 cells, n = 40). (C) Treatments with the COX inhibitors S(+)‐Ibuprofen (4.512 ± 0.375 cells, n = 43; Unpaired t‐test; p‐value <0.0001) and Nimesulide (4.241 ± 0.519 cells, n = 29; Unpaired t‐test; p‐value = 0.0003) reduced the numbers of serotonergic neurons in the ventral spinal cord as compared to DMSO controls (7.367 ± 0.563 cells, n = 49). (D) Animals treated with S(+)‐Ibuprofen (294.2 ± 69.20 cm, n = 49; Mann–Whitney test; p‐value <0.0001) and Nimesulide (155.5 ± 50.63 cm, n = 42; Mann–Whitney test; p‐value <0.0001) (see C) showed significant locomotor deficits as compared to DMSO controls (1499 ± 163.1 cm, n = 60). Examples of 10‐min swim tracks (with light) are shown to the left. Total locomotor activity, which was recorded for 1 h (6 10‐min periods alternating light and dark conditions), is shown in the graphs. Rostral is to the right and dorsal to the top in all photomicrographs. Scale bars: 25 μm.
|
