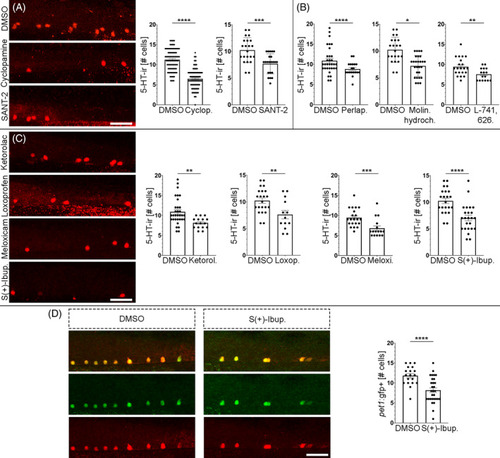
An unbiased drug screen reveals new small molecules and signalling pathways that control neurogenesis in the ventral spinal cord. (A) Treatments with the Shh signalling inhibitor Cyclopamine (6.487 ± 0,224 cells, n = 117; Mann–Whitney test; p‐value <0.0001) or the smoothened receptor antagonist SANT‐2 (7.682 ± 0.402 cells, n = 22; Unpaired t‐test; p‐value = 0.0003) reduced the numbers of serotonergic neurons (red fluorescence) in the ventral spinal cord as compared to DMSO controls (Cyclopamine control: 11.24 ± 0.264 cells, n = 101; SANT‐2 control: 10.23 ± 0.496 cells, n = 22). (B) Treatments with anti‐dopaminergic drugs from the LOPAC library (Perlapine: 7.222 ± 0.375 cells, n = 27; Unpaired t‐test; p‐value <0.0001; molindone hydrochloride: 8.842 ± 0.384 cells, n = 19; Unpaired t‐test; p‐value = 0.0142; L‐741,626: 7.563 ± 0.376 cells, n = 21; Unpaired t‐test; p‐value = 0.0067) reduced the numbers of serotonergic neurons in the ventral spinal cord as compared to DMSO controls (Perlapine control: 10.23 ± 0.496 cells, n = 22; molindone hydrochloride control: 10.91 ± 0.581 cells, n = 32; L‐741,626 control: 9.429 ± 0.486 cells, n = 16). (C) Treatments with COX inhibitors from the LOPAC library (Ketorolac: 8.125 ± 0.340 cells, n = 16; Unpaired t‐test; p‐value = 0.0022; Loxoprofen: 7.615 ± 0.789 cells, n = 13; Unpaired t‐test; p‐value = 0.0058; Meloxicam: 6.813 ± 0.579 cells, n = 16; Mann–Whitney test; p‐value = 0.0005; S(+)‐Ibuprofen: 7.000 ± 0.532 cells, n = 24; Unpaired t‐test; p‐value <0.0001) reduced the numbers of serotonergic neurons in the ventral spinal cord as compared to DMSO controls (Ketorolac control: 10.91 ± 0.581 cells, n = 32; Loxoprofen control: 10.23 ± 0.496 cells, n = 13; Meloxicam control: 9.429 ± 0.486 cells, n = 21; S(+)‐Ibuprofen control: 10.23 ± 0.496 cells, n = 22). (D) A treatment with the COX inhibitor S(+)‐Ibuprofen (8.200 ± 0.582 cells, n = 30; Unpaired t‐test; p‐value <0.0001) reduced the numbers of serotonergic pet1+ neurons in the ventral spinal cord of pet1:gfp fish as compared to DMSO controls (11.84 ± 0.542 cells, n = 19). Note the perfect colocalization of serotonin (red) and gfp (green) immunofluorescence signals in serotonergic cells. Rostral is to the right and dorsal to the top in all photomicrographs. Scale bars: 25 μm.
|
