
Fig. 3
- ID
- ZDB-FIG-240430-22
- Publication
- Emond et al., 2023 - Quantitation of mitotic cells in the neural tube of zebrafish embryos using automated nuclei counting
- Other Figures
- All Figure Page
- Back to All Figure Page
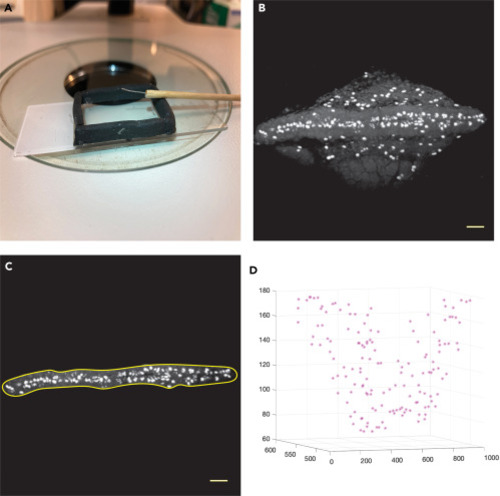
Imaging chamber, steps of image processing and final 3D graph showing nuclei counted within region of interest (A) Shown here is one example of an imaging chamber, made using Sugru to create walls to hold buffer on a standard 3 inch by 1 inch slide. The embryo orienting tool was made using monofilament fishing line and the handle of a long cotton swab. (B) A maximum intensity projection of a 128 image stack of phospho-histone H3-immunopositive cells in an 18 hpf embryo was made using Fiji/ImageJ image processing program. Scale bar, 50 μm. (C) The freehand selection tool was used to select the nuclei located within the neural tube and to exclude labeled cells on the surface of the yolk. The selection was applied to the image stack and the “Clear Outside” function was selected to remove the surrounding nuclei. Scale bar, 50 μm. (D) Running the MATLAB Script “Auto_count.m” on the processed image stack yields a total count of labeled nuclei found only within the neural tube throughout the 128 images. Scale bar, 50 μm. |