
FIGURE
Fig. 1
- ID
- ZDB-FIG-240430-20
- Publication
- Emond et al., 2023 - Quantitation of mitotic cells in the neural tube of zebrafish embryos using automated nuclei counting
- Other Figures
- All Figure Page
- Back to All Figure Page
Fig. 1
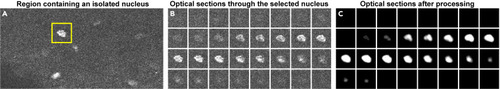
Steps to isolating a well labeled nucleus to use as a template (A) Shown here is a region of a single optical section from an image stack. An isolated nucleus is shown in the yellow box. (B) The boxed region in A was cropped to a 32 × 32 × 32 volume with the nucleus centered within the volume and no other fluorescent objects present within the volume. (C) The template was processed by applying a Gaussian Blur (radius = 1.5) and adjusting brightness and contrast. |
Expression Data
Expression Detail
Antibody Labeling
Phenotype Data
Phenotype Detail
Acknowledgments
This image is the copyrighted work of the attributed author or publisher, and
ZFIN has permission only to display this image to its users.
Additional permissions should be obtained from the applicable author or publisher of the image.
Full text @ STAR Protoc