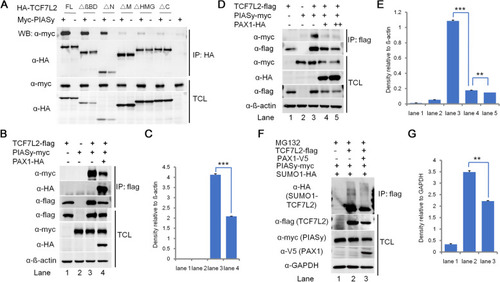
PAX1 inhibits the interaction between TCF7L2 and PIASy, and decreases the SUMOylation level of TCF7L2. A PIASy interacts with the middle, HMG and C-terminal domains of TCF7L2. Different HA-tagged TCF7L2 deletion constructs depicted in Fig. S2A were transiently transfected into HEK293FT cells together with Myc-tagged PIASy. Cell lysates were immunoprecipitated with M2 beads (anti-flag), followed by western blotting using anti-HA for TCF7L2 proteins and anti-Myc for PIASy. B Interactions between TCF7L2 and PIASy were assessed by co-IP and western blotting with empty vector control or PAX1-HA cotransfection. HEK293FT cells were transfected with flag-tagged TCF7L2 together with PIASy-myc and PAX1-HA plasmids. Following co-IP with M2 beads, TCL and IP samples were assayed by western blotting using anti-myc antibody for PIASy and anti-HA antibody for PAX1, respectively. ß-actin was used as loading control. C Densitometry analysis of western blots in (B) (n = 2, mean ± SD. *P < 0.05, **P < 0.01, ***P < 0.001). D PAX1 disturbs the interaction between TCF7L2 and PIASy in a dose-dependent manner. Same as (B) except increasing amount of HA-PAX1 (0 μg, 1 μg, and 2 μg) were transfected into HEK293FT cells together with flag-TCF7L2 and myc-PIASy. When flag-tagged TCF7L2 was immunoprecipitated by M2 beads (anti-flag), the amount of coprecipitated Myc-tagged PIASy was negatively correlated with the dose of cotransfected PAX1. E Densitometry analysis of western blots in (D) (n = 2, mean ± SD. *P < 0.05, **P < 0.01, ***P < 0.001). F Western blotting analysis of SUMOylation level of TCF7L2. HEK293FT cells were cotransfected with plasmids expressing flag-TCF7L2, V5-PAX1, and HA-tagged SUMO1. Cells were treated with proteasome inhibitors MG132 (10 μM) for 6 hours before harvested. GAPDH was used as loading control. G Densitometry analysis of western blots in (F) (n = 2, mean ± SD. *P < 0.05, **P < 0.01, ***P < 0.001)
|
