
FIGURE
Fig. 4
- ID
- ZDB-FIG-240426-5
- Publication
- La Pietra et al., 2024 - Polystyrene microplastics effects on zebrafish embryological development: comparison of two different sizes
- Other Figures
- All Figure Page
- Back to All Figure Page
Fig. 4
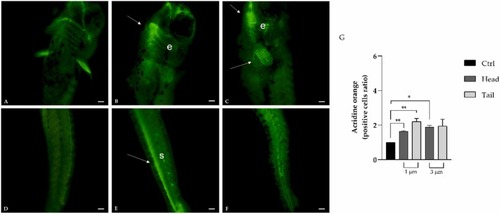
Whole mount acridine orange staining of control larvae (A, D) or larvae exposed to 1 µm (B, E) or 3 µm (C, F) MPs. Upper panels: heads; lower panels, tails. Fluorescent spots (arrows); eye (e), somites (s). (G) Results of semiquantitative analyses demonstrating data significance. The graph shows the semi-quantitative analysis reported as the ratio of acridine orange positive cells. Statistical differences were determined by ANOVA followed by Tukey's test (* p < 0.05; ** p < 0.01). Scale bar: 50 µm. |
Expression Data
Expression Detail
Antibody Labeling
Phenotype Data
Phenotype Detail
Acknowledgments
This image is the copyrighted work of the attributed author or publisher, and
ZFIN has permission only to display this image to its users.
Additional permissions should be obtained from the applicable author or publisher of the image.
Full text @ Environ. Toxicol. Pharmacol.