
FIGURE
Fig. 3
- ID
- ZDB-FIG-240426-4
- Publication
- La Pietra et al., 2024 - Polystyrene microplastics effects on zebrafish embryological development: comparison of two different sizes
- Other Figures
- All Figure Page
- Back to All Figure Page
Fig. 3
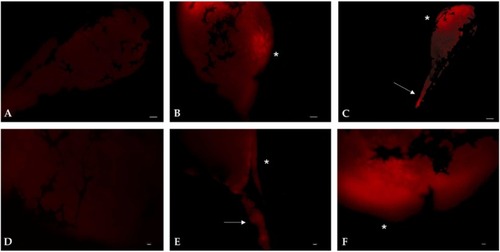
Nile red staining of control larvae (A, D) or larvae exposed for 72 h to PS-MPs 1 µm (B, E) or 3 µm (C, F). (10.0 mgL-1). (A, D) Unstained larvae. (B-C; E-F) Larvae with intense fluorescence in correspondence of yolk sac (*) and intestinal tract (arrows). Scale bar (A, B, C): 10 µm; scale bar (D, E; F): 5 µm. |
Expression Data
Expression Detail
Antibody Labeling
Phenotype Data
Phenotype Detail
Acknowledgments
This image is the copyrighted work of the attributed author or publisher, and
ZFIN has permission only to display this image to its users.
Additional permissions should be obtained from the applicable author or publisher of the image.
Full text @ Environ. Toxicol. Pharmacol.