
Fig. 2
- ID
- ZDB-FIG-240419-21
- Publication
- Ambrosio et al., 2024 - LiverZap: a chemoptogenetic tool for global and locally restricted hepatocyte ablation to study cellular behaviours in liver regeneration
- Other Figures
- All Figure Page
- Back to All Figure Page
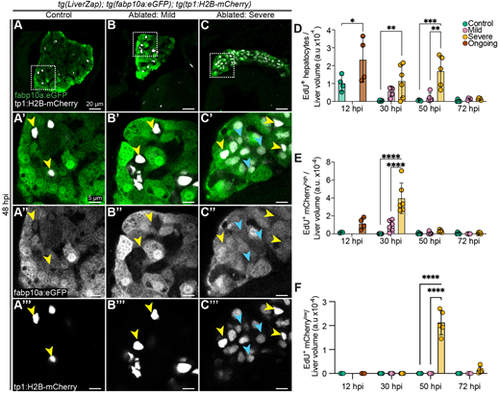
Severe liver injury after LiverZap activation triggers the LPC programme. (A-C‴) Expression of tg(Tp1:H2B-mCherry) marking BECs (grey) and tg(fabp10a:eGFP) highlighting hepatocytes (green) is mutually exclusive in control and mildly ablated livers (A-B″; N=4, n>7). In severely ablated livers (C-C‴), LPC-derived hepatocytes show low mCherry (blue arrowheads) whereas BECs show high mCherry (yellow arrowheads) expression. Dotted squares in A-C indicate corresponding magnifications shown in A′-C‴; 5 µm maximum intensity projections. (D-F) Cell type-specific quantification of EdU incorporation in mild and severely LiverZap-ablated livers (N=2, n>3). Statistical significance was determined by two-way ANOVA followed by Tukey's multiple comparison tests (*P<0.05, **P<0.01, ***P<0.001, ****P<0.0001). a.u., arbitrary units. Error bars represent s.d. Scale bars: 20 µm (A-C); 5 µm (A′-C‴). |