Fig. 6
- ID
- ZDB-FIG-240417-19
- Publication
- Lin et al., 2023 - Extracellular Matrix Disorganization Caused by ADAMTS16 Deficiency Leads to Bicuspid Aortic Valve With Raphe Formation
- Other Figures
- All Figure Page
- Back to All Figure Page
|
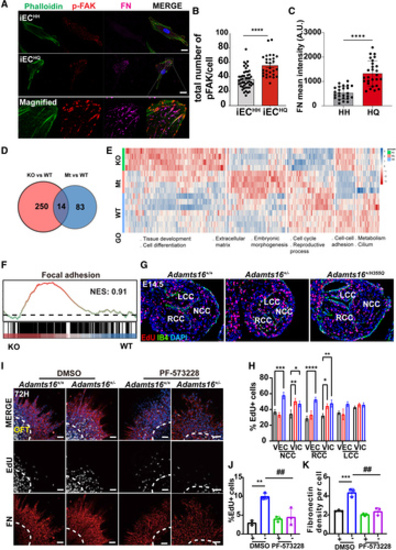
ADAMTS16 deficiency leads to hyperproliferation of valve mesenchymal cells and upregulation of the FAK signaling pathway. A, Immunostaining of phospho-FAK (Tyr397, red), FN (magenta), and phalloidin (green) in iPSC-ECH/H and iPSC-ECH/Q. Scale bars=20 µm. B, Quantification of phospho-FAK (Tyr397) staining in iPSC-ECs. P values were calculated using the Student t test (n=48 for iPSC-ECH/H and n=28 for iPSC-ECH/Q; ****P<0.0001). C, Quantification of FN staining in iPSC-ECs. P values were calculated using the Student t test (n=25 for iPSC-ECH/H and n=27 for iPSC-ECH/Q). ****P<0.0001. D, Venn diagram summarized the 14 common differentially expressed genes (DEGs) among Adamts16+/+, Adamts16+/-, and Adamts16+/H355Q mice. A total of 250 DEGs were identified between Adamts16+/- and Adamts16+/+ mice, and 83 DEGs were discovered between Adamts16+/H355Q and Adamts16+/+ mice. E, Heatmap with cluster and gene set enrichment analysis (GSEA) of DEGs with main biological processes involved in each cluster. F, GSEA of positive regulation of the focal adhesion signaling pathway in Adamts16+/- mice compared with Adamts16+/+ mice. G, Immunostaining of EdU-labeled cells in aortic valves of E14.5 embryos. The EdU-stained cells represented proliferated cells in the valve region. IB4 staining marks valvar endothelial cells (green). Scale bar=100 µm. H, Quantification of EdU-positive cells. The data are presented as the ratio of EdU-positive cells to total valvar endothelial cells or to total valvar interstitial cells in the 3 valve cusps (n=5 for each genotype, and statistical comparison was performed using 2-way ANOVA followed by the Tukey post hoc test). ****P<0.0001; ***P<0.001; **P<0.01; *P<0.05. I, Immunostaining of FN and EdU-labeled cells in outflow tract (OFT) endocardial cushion explants after 72 hours of culture. Either DMSO or a FAK inhibitor (PF-573228, 100 nM) was added to the culture medium for 60 to 72 hours. Scale bars=100 µm. J, Quantification of EdU-positive cells in Adamts16+/+ and Adamts16+/- OFT explants supplemented with or without PF-573228 (n=3). P values were calculated using 2-way ANOVA with the Tukey multiple comparisons test. **P<0.01; ##P<0.01. K, Quantification of fibronectin staining in Adamts16+/+ and Adamts16+/- OFT explants supplemented with or without PF-573228 (n=3). P values were calculated using 2-way ANOVA with the Tukey multiple comparisons test. ##P<0.01; ***P<0.001. ADAMTS indicates a disintegrin and metalloproteinase with thrombospondin motifs; FN, fibronectin; GO, gene ontology; GOBP, GO biological process; KO, Adamts16+/-; LCC, left coronary cusp; Mt, Adamts16+/H355Q; NCC, noncoronary cusp; NES, normalized enrichment score; RCC, right coronary cusp; VECs, valvular endothelial cells; VICs, valvular interstitial cells; and WT, wild-type, Adamts16+/+. |

