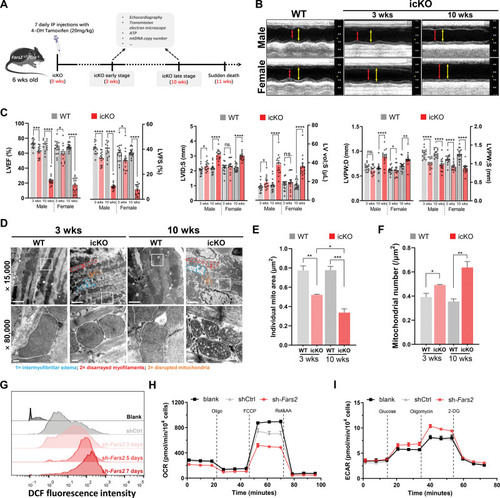
Defective myocardial and mitochondrial functions in Fars2 deficiency models. A, Schematic diagram of experimental protocol in mice. B, Representative M-mode echocardiographic images from the mice 3 and 10 weeks after inducible cardiac-specific Fars2 knockout (icKO). End-systole stages are indicated by red lines and end-diastole stages by yellow lines. C, Echocardiographic quantifications of wild-type (WT) and icKO mice. Shown in the statistical graph are left ventricular ejection fraction (LVEF) and left ventricular fractional shortening (LVFS; left panel), left ventricular systolic internal diameters (LVID;S) and left ventricular volume at end-systole (LV vol;S; middle panel), and left ventricular posterior wall thickness at end-diastole (LVPW;D) and left ventricular posterior wall thickness at end-systole (LVPW;S; right panel). D, Mitochondrial and myocardial dysmorphometry evoked by FARS2 (mitochondrial phenylalanyl-tRNA synthetase) deficiency. Transmission electron microscopy images (×15 000 and ×80 000); representative cardiomyocyte mitochondria are emphasized by white lines. A representative intermyofibrillar edema area is indicated by blue lines, a representative disarrayed myofilaments area by red lines, and a representative disrupted mitochondria area by orange lines. Top panel scale bar=2 μm; bottom panel scale bar=200 nm. E, Quantification of the average individual mitochondrial area (μm2) from D (n=3). F, Quantification of the average mitochondrial number (μm2) from D (n=3). G, Increase of reactive oxygen species production in Fars2 knockdown neonatal rat ventricular myocytes at 3, 5, and 7 days by DCFH-DA staining. H, Oxygen consumption rate in neonatal rat ventricular myocytes infected with shCtrl or sh-Fars2 at 3 days. I, Extracellular acidification rate in neonatal rat ventricular myocytes infected with shCtrl or sh-Fars2 at 3 days.
|
