
Fig. 9
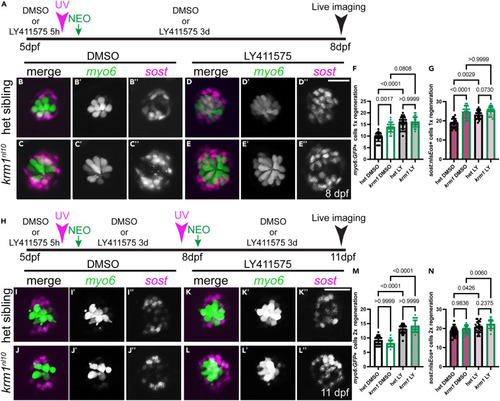
Notch signaling alters NM cell numbers following repeated damage (A) Timeline of drug exposure from 5-8dpf, photoconversion, NEO exposure, regeneration, and live imaging. (B–E″) Live confocal projections of Tg(myosin6b:GFP)w186 labeled cells (myo6, green) and Tg(sost:nlsEos)w215 labeled cells (sost, magenta) in larvae exposed to DMSO or LY411575 and 1 round of regeneration in heterozygous sibling krm1nl10 mutant larvae. (F–G) Quantification of Tg(myosin6b:GFP)w186 labeled hair cells and Tg(sost:nlsEos)w215 labeled cells at 8dpf following regeneration during exposure to DMSO or LY411575. DMSO-exposed heterozygous siblings n = 20 NM (9 fish) and krm1nl10 n = 21 NM (9 fish); LY411575-exposed heterozygous siblings n = 22 NM (9 fish) and krm1nl10 n = 25 NM (11 fish). (H) Timeline for drug exposure, Tg(sost:nlsEos)w215 photoconversion and NEO at 5dpf and again at 8dpf, for 2 rounds of regeneration until 11dpf. (I–L″) Heterozygous sibling and krm1nl10 mutant larvae exposed to DMSO or LY411575 during 2 rounds of regeneration. (M and N) Quantification of Tg(myosin6b:GFP)w186 labeled cells and Tg(sost:nlsEos)w215 labeled cells following 2 rounds of regeneration in the presence of DMSO or LY411575. DMSO-exposed heterozygous siblings n = 24 NM (11 fish) and krm1nl10 n = 23 NM (10 fish); LY411575-exposed heterozygous siblings n = 22 NM (8 fish) and krm1nl10 n = 24 NM (10 fish). All data presented as mean ± SD, Kruskal-Wallis test, Dunn’s multiple comparisons test. Scale bar = 20 μm. See also Figure S3. |