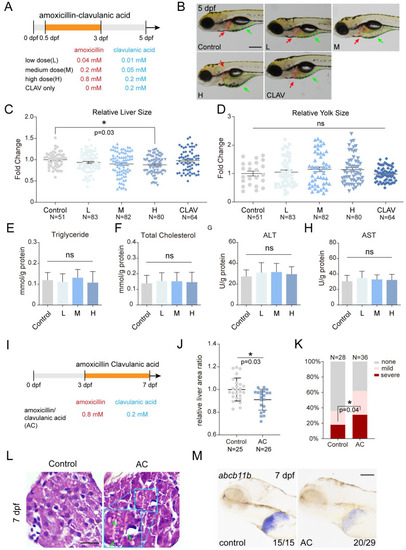
Co-treatment of amoxicillin and clavulanic acid affects zebrafish liver development and function. (A) Schematic diagram of early amoxicillin and clavulanic acid co-treatment from 0.5 to 3 dpf. (B) The liver and yolk morphology of Tg(fabp10a:mCherry; ela:eGFP) larvae at 5 dpf after early amoxicillin and clavulanic acid co-treatment. The red dashed lines and arrows indicate liver area; the green dashed lines and arrows indicate yolk area. (C,D) Quantification of relative sizes of liver and yolk in 5 dpf larvae after early amoxicillin and clavulanic acid co-treatment. The numbers of larvae analyzed in each group are indicated. Mean + s.e.m. In the ANOVA analysis, * indicates p < 0.05, ns—not significant. (E–H) Quantification of triglyceride, total cholesterol, ALT activity, and AST activity in 5 dpf larvae after early amoxicillin and clavulanic acid co-treatment. 3 independent experiments. Mean + s.e.m. In the ANOVA analysis, ns—not significant. (I) Schematic diagram of late amoxicillin and clavulanic acid co-treatment from 3 to 7 dpf. (J) Quantification of relative liver size in 7 dpf larvae after late amoxicillin and clavulanic acid co-treatment. The numbers of larvae analyzed in each group are indicated. Mean + s.e.m. In Student’s t-test, * indicates p < 0.05. (K) Quantification of hepatic steatosis by ORO staining in 7 dpf larvae after late amoxicillin and clavulanic acid co-treatment. The numbers of larvae analyzed in each group are indicated. In Chi-square test, * indicates p < 0.05. (L) H&E staining of liver tissues at 7 dpf after late amoxicillin and clavulanic acid co-treatment. Arrows point to fat vacuole. (M) WISH revealed the expression of abcb11b at 7dpf after late amoxicillin and clavulanic acid co-treatment. Numbers indicate the ratio of representative staining observed. Scale bars: (B,L) 100 µm, (M) 5 µm. dpf—days post-fertilization; AMX—amoxicillin; CLAV—clavulanic acid; AC—amoxicillin- clavulanic acid; L—low dose AC; M—medium dose AC; H—high dose AC.
|
