|
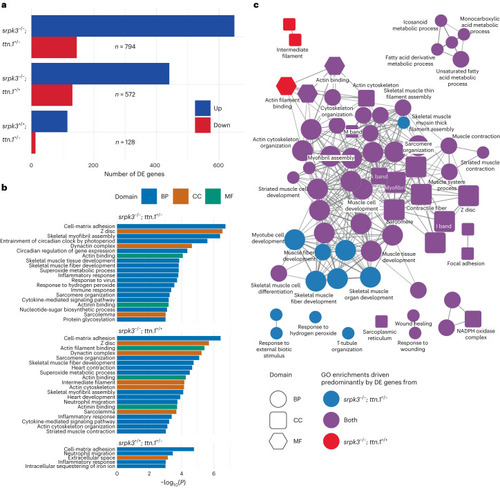
Transcriptome analysis of mutant zebrafish larvae. a, Number of DE genes between WT and double mutant (top: srpk3−/−; ttn.1+/−; n = 794), srpk3-null (middle: srpk3−/−; ttn.1+/+; n = 572) and heterozygous ttn.1 (bottom: srpk3+/+; ttn.1+/−; n = 128) zebrafish. Upregulated genes are in blue and downregulated genes are in red. b, GO term enrichment analysis. GO term enrichment was done using the topGO package using a one-sided Fisher’s exact test without adjustment for multiple testing. The top enriched GO terms (P < 0.001) for the three comparisons in a ordered by −log10(P). The bars are colored according to the GO domain. Blue indicates BP; orange indicates CC; green indicates MF. c, ClueGO network diagram showing the overlap in enriched GO terms between double mutant (srpk3−/−; ttn.1+/−) and srpk3-null (srpk3−/−; ttn.1+/+). Nodes represent individual enriched GO terms; edges connect nodes that share annotated genes from the DE genes. Nodes are colored according to the contribution to the enrichment from DE genes from each comparison. Blue indicates >60% DE genes from the srpk3−/−; ttn.1+/− comparison; red indicates >60% DE genes from srpk3−/−; ttn.1+/+; purple indicates 40–60% from each comparison. BP, biological process; CC, cellular component; MF, molecular function.
|