FIGURE

Fig 2

ID
ZDB-FIG-240310-2
Publication
Ruan et al., 2024 - New insights into the all-testis differentiation in zebrafish with compromised endogenous androgen and estrogen synthesis
Other Figures
All Figure Page
Back to All Figure Page
Fig 2

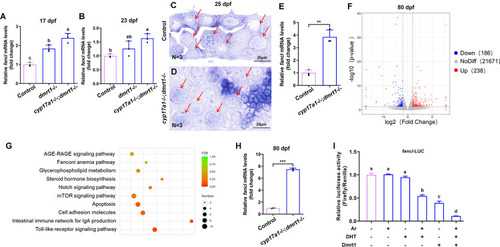
The cyp17a1-/-;dmrt1-/- fish exhibited increased expression of fancl.

(A and B) Relative expression of fancl in control fish, dmrt1-/- fish and cyp17a1-/-;dmrt1-/- fish at 17 dpf and 23 dpf was tested with qPCR. For fish RNA sampling at 17 dpf and 23 dpf, every 5 body trunks of fish collected were mixed into one sample, and 3 samples were examined. (C and D) In situ hybridization was performed on cryosections of presumptive ovaries from control fish and cyp17a1-/-;dmrt1-/- fish at 25 dpf using the antisense probe of fancl. Arrows point to the immature oocytes. (E) Comparison of differentially expressed gene in the ovaries of control fish and cyp17a1-/-;dmrt1-/- fish at 80 dpf. Volcano plot shows genes that were differentially expressed in ovaries between control and cyp17a1-/-;dmrt1-/- fish. (F) Gene set enrichment analysis based on genes differentiated expressed in cyp17a1-/-;dmrt1-/- fish at 80 dpf. The length of the bar represents the false discovery rate (FDR). (G) Relative expression of fancl in the ovaries of control fish and cyp17a1-/-;dmrt1-/- fish at 80 dpf with qPCR. For fish at 80 dpf, every three dissected ovaries were mixed as one sample, and 3 samples were examined. (H) The effect of Dmrt1 and DHT/Ar in regulating the relative luciferase activity driven by fancl promoter. DHT, dihydrotestosterone. ***, p < 0.001. Different letters in the bar chart represent significant differences.

Expression Data

Expression Detail
Antibody Labeling
Phenotype Data

Phenotype Detail
Acknowledgments
This image is the copyrighted work of the attributed author or publisher, and ZFIN has permission only to display this image to its users. Additional permissions should be obtained from the applicable author or publisher of the image. Full text @ PLoS Genet.