|
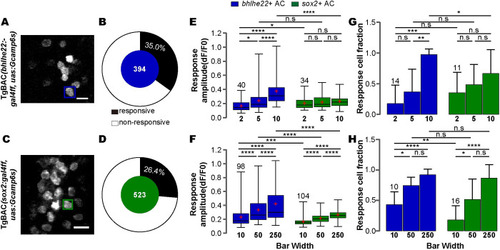
bhlhe22+ and sox2+ type show conversely preference to object size. (A and B) Representative capture (A) and donut plot (B) showing the responsive cell ratio of bhlhe22+ type to a small (2/5/10) and large (10/50/250) bar widths serial together. (C and D) Representative capture (C) and donut plot (D) showing the responsive cell ratio of sox2+ type to a small (2/5/10) and large (10/50/250) bar widths serial together. Rectangle on the capture showing an ROI of calcium activity analysis. (E and F) Bar plot showing the response amplitude of bhlhe22+ and sox2+ responsive type to small (E, n = 40 and n = 34 of bhlhe22+ and sox2+ type soma, respectively) and large (F, n = 98 and n = 104 of bhlhe22+ and sox2+ type soma, respectively) bar widths serial. Friedman test and subsequent Dunn’s multiple comparisons test within pairing wise groups (3 groups within small or large range). Mann–Whitney test between bhlhe22+ and sox2+ type groups. (G and H) Bar plot showing the responsive cell fraction of bhlhe22+ and sox2+ responsive type from TgBAC(bhlhe22: gal4ff,uas:gcamp6s) and TgBAC(sox2:gal4ff,uas:gcamp6s) to small (G,n = 14 and n = 11 of bhlhe22+ and sox2+ type animal, respectively) and large (H,n = 10 and n = 16 of bhlhe22+ and sox2+ type animal, respectively) bar widths serial. The data underlying this figure can be found in S3 Data. Scale bars, 10 μm. n.s > = 0.05, * p < 0.05, ** p < 0.01, *** p < 0.001, **** p < 0.000.
|