
Fig 5
- ID
- ZDB-FIG-240222-99
- Publication
- Godivier et al., 2024 - Compressive stress gradients direct mechanoregulation of anisotropic growth in the zebrafish jaw joint
- Other Figures
- All Figure Page
- Back to All Figure Page
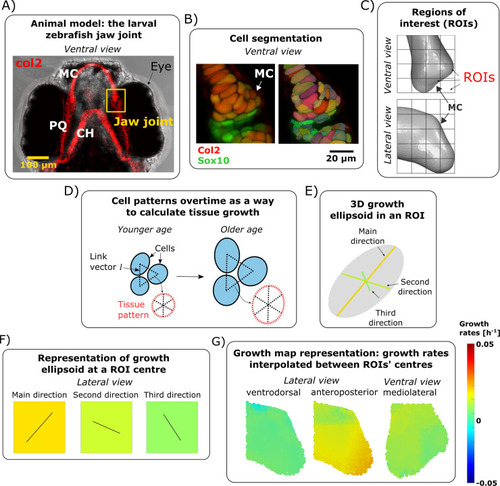
Growth rate calculations. (A) Brightfield ventral view of a 7 dpf zebrafish head expressing Tg(Col2a1aBAC:mCherry) cartilage marker showing the location of the jaw joint (yellow box). (B) Confocal ventral view of the jaw joint of a live 4.5 dpf zebrafish expressing the transgenic reporters Col2a1aBAC:mcherry (red) and -4.9sox10:eGFP (green) which mark cartilage chondrocytes. Cell segmentation result is shown on the right. (C) A grid marks out the regions (ROIs) of the anterior joint element in which growth is characterised. The length of each cube side is 15μm. (D) The position of cells with respect to each other forms a pattern. This pattern evolves over time and is used to characterise growth. (E) Computed growth is represented by an ellipsoid with orthogonal axes. The ellipsoid’s radii correspond to the growth rates and their orientation to the direction of deformation. (F) At an ROI centre, growth rate is represented by the square’s colour while the direction of growth is shown by solid black lines in the corresponding square. (G) Growth rates are interpolated between ROI centres to obtain the resulting growth maps. For simplicity, the orientation of deformation is approximated based on anatomical axes, actual orientations (as defined by the axes of growth ellipsoids) are provided in |