
Fig 3
- ID
- ZDB-FIG-240222-97
- Publication
- Godivier et al., 2024 - Compressive stress gradients direct mechanoregulation of anisotropic growth in the zebrafish jaw joint
- Other Figures
- All Figure Page
- Back to All Figure Page
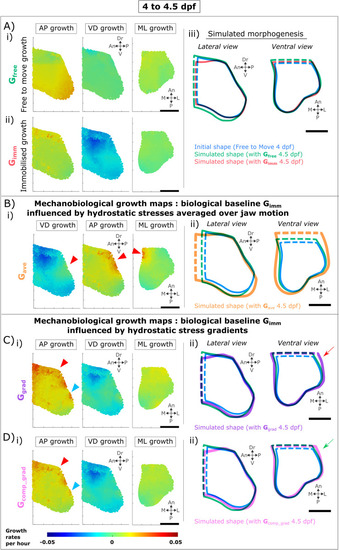
Mechanobiological simulations of zebrafish larval jaw joint morphogenesis from 4–4.5 dpf incorporating different biological and mechanobiological contributions. A) Biological contributions to morphogenesis in the absence of movements lead to undergrowth of MC depth and length compared to free-to-move shapes. A-i) Immobilised ventrodorsal (VD), anteroposterior (AP) & mediolateral (ML) growth rates applied to free-to-move 4 dpf shape. A-ii) Free-to-move growth rates. A-iii) Outlines of simulated morphogenesis with immobilised or free-to-move growth rates promoting growth. B) Hydrostatic stresses averaged over jaw motion when used as the mechanoregulatory stimulus fail to simulate physiological jaw joint morphogenesis. B-i) Mechanobiological growth rates with compression promoting growth. Red arrowheads point to local areas of non-physiological elevated growth rates. B-ii) Outlines of simulated morphogenesis. C) Hydrostatic stress gradients as mechanobiological stimulus offer enhanced predictions of jaw joint morphogenesis. C-i) Mechanobiological growth maps in which the biological baseline |