
FIGURE
Fig 2
- ID
- ZDB-FIG-240222-95
- Publication
- Godivier et al., 2024 - Compressive stress gradients direct mechanoregulation of anisotropic growth in the zebrafish jaw joint
- Other Figures
- All Figure Page
- Back to All Figure Page
Fig 2
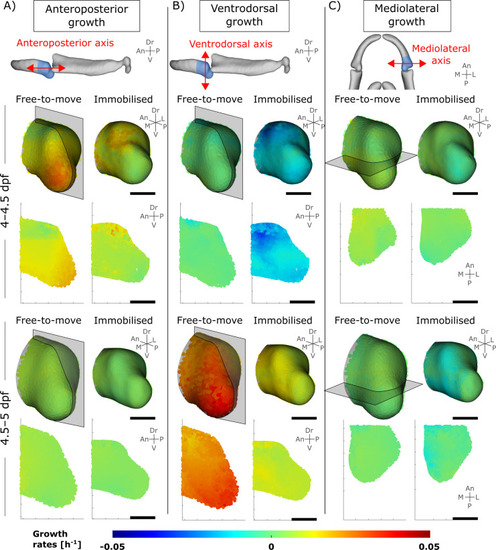
Immobilisation leads to altered growth rates, primarily along the ventrodorsal axis. Growth rates computed from tracked cells over period of interest. (A–C) Top panel: Illustration of the axes used for visualisation of growth anisotropy. Bottom panels: anteroposterior, ventrodorsal and mediolateral MC growth rates from 4–4.5 and 4.5–5 dpf for both free-to-move and immobilised larvae. Results are displayed in 3D and in one section in the lateral or ventral plane (section location shown in the 3D views). An: Anterior, Dr: Dorsal, L: Lateral, M: Medial, P: Posterior, V: Ventral. |
Expression Data
Expression Detail
Antibody Labeling
Phenotype Data
Phenotype Detail
Acknowledgments
This image is the copyrighted work of the attributed author or publisher, and
ZFIN has permission only to display this image to its users.
Additional permissions should be obtained from the applicable author or publisher of the image.
Full text @ PLoS Comput. Biol.