
Fig. 5
- ID
- ZDB-FIG-240222-40
- Publication
- Cassidy et al., 2023 - Systematic analysis of proximal midgut- and anorectal-originating contractions in larval zebrafish using event feature detection and supervised machine learning algorithms
- Other Figures
- All Figure Page
- Back to All Figure Page
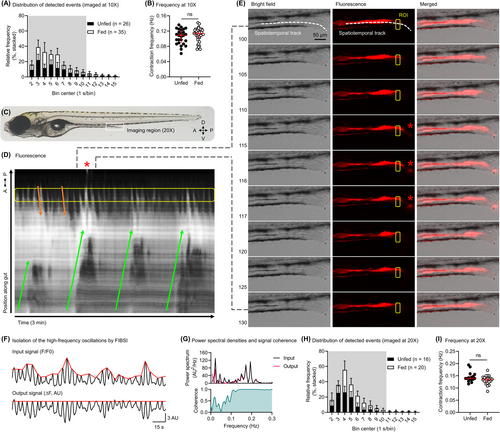
Measuring anorectal-originating retrograde contractions in unfed and fed larvae. (A) Relative frequencies (%) of event durations detected by FIBSI in ROI #19 (refer to Figure 1H) of unfed and fed larvae. Minimum detectable duration was 2 s. Results represent the mean ± SD. (B) aRC frequencies (Hz) measured after excluding events with duration >10 s (gray box in A). Results represent the median with interquartile range; Mann Whitney U-test, p = 0.3355, U statistic = 388.5. (C) Wild-type AB zebrafish larvae at 7–8 dpf with the imaging region over the distal midgut and hindgut regions (solid white line, 20× objective). Anterior/posterior (A/P) and dorsal/ventral (D/V) axis shown. (D) Example fluorescence STM with pAC (green arrows), aRC (orange arrows), and ROI (solid yellow box). (E) Bright field, fluorescence, and merged image series corresponding to the selected period in the fluorescence STM in D (period marked by dotted black lines). Corresponding spatiotemporal track (dotted white line), ROI, frame numbers (1 frame = 0.565 s), and excretion event (red star, frames 115–117) labeled. (F) Isolation of the aRCs in the ROI from D by FIBSI. (G) Power spectral densities corresponding to the two signals in F and their coherence. (H) Relative frequencies (%) of event durations in unfed and fed larvae imaged using 20× objective. Events were detected by FIBSI from selected ROIs that spatially corresponded to the aRCs (1 ROI per larva). Minimum detectable duration in each dataset was 2 s. Results represent the mean ± SD. (I) aRC frequencies (Hz) measured after excluding events with duration >10 s (gray box in H). Results represent the median with interquartile range; Mann Whitney U-test, p = 0.1167, U statistic = 110.5. |