
Fig. 4
- ID
- ZDB-FIG-240221-4
- Publication
- Liu et al., 2024 - Live tracking of basal stem cells of the epidermis during growth, homeostasis and injury response in zebrafish
- Other Figures
- All Figure Page
- Back to All Figure Page
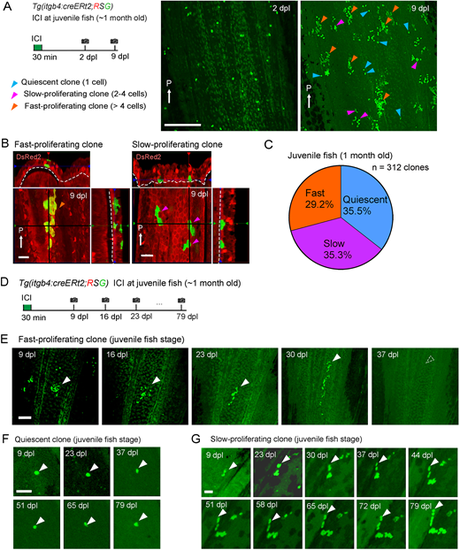
Tracking of the basal cell behaviour in juvenile fish. (A) Tracking of the itgb4:cre-labelled cells at a single cell resolution in the 1-month-old juvenile fish fin. Fish were treated with 0.5 µM ICI to sparsely label the itgb4+ basal cells. dpl, days post labelling. The same region of the tissue was imaged in a 1-week time window (2-9 dpl). The EGFP+ cells displayed three proliferation patterns: quiescent (1 cell, blue arrowheads), slow-proliferating (2-4 cells, purple arrowheads) and fast-proliferating (>4 cells, orange arrowheads). White arrows indicate the posterior end (P) of fins. Experimental procedure is shown on the left. Scale bar: 200 µm. (B) Confocal images and their optical sections of fast-proliferating and slow-proliferating clones in the juvenile fish fin. Note that the fast-proliferating clone only contains non-basal cells, whereas the slow-proliferating clone only contains the basal cells. White arrows indicate the posterior side (P). Scale bars: 20 µm. (C) Ratios of clones with respective proliferation patterns (n=312 clones from five juvenile zebrafish). (D) Experimental scheme of long-term tracking of clonal cell fates. Time-lapse images were taken at intervals of 7 days. (E) Representative image of fast-proliferating clones. They quickly proliferated, but finally disappeared in the long run, suggesting that such clones did not contain the basal stem cells. Scale bar: 100 µm. (F) Representative image of quiescent clone. These clones kept quiescent for more than 79 dpl. Scale bar: 50 µm. (G) Representative image of slow-proliferating clone, which slowly expanded the clone size and maintained for more than 79 days. Scale bar: 30 µm. White arrowheads indicate examples of tracked clones. |