|
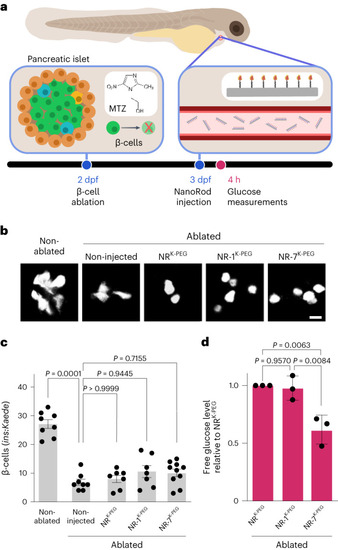
Valency of insulin on NanoRods determines their capacity to lower free glucose in β-cell-ablated zebrafish larvae. a, Schematic of the zebrafish model, which expresses the enzyme nitroreductase (NTR) under the control of the insulin promoter and converts the MTZ compound into a toxic byproduct that ablates β-cells. Larvae were treated with MTZ at 2 dpf for 24 h. Double-transgenic larvae, Tg(ins:CFP-NTR);Tg(ins:Kaede), were used to visualize β-cells with the fluorescent protein Kaede. NRK-PEG, NR-1K-PEG or NR-7K-PEG was intravenously injected into larvae at 3 dpf and the measurements of free glucose levels were taken 4 hpi. b, Confocal microscopy imaging of the Kaede fluorescent protein expressed in pancreatic β-cells in the indicated conditions. Scale bar, 10 µm. c, Bar plots of the quantifications of Kaede+ β-cells. Two independent experiments were performed; one representative experiment is shown where each dot corresponds to a larva. The values are presented as mean ± s.e.m. n = 8 (non-ablated, ablated non-injected), n = 7 (NRK-PEG, NR-1K-PEG), n = 10 (NR-7K-PEG). The P values are determined by a Kruskal–Wallis test with Dunn’s multiple comparisons test. d, Bar plots of free glucose levels in NR-1K-PEG- and NR-7K-PEG-treated larvae relative to NRK-PEG-treated larvae. The values are presented as mean ± s.d. n = 3 independent experiments (Extended Data Fig. 9e). The P values are determined by one-way ANOVA with Tukey’s multiple comparisons test. Source data
|