|
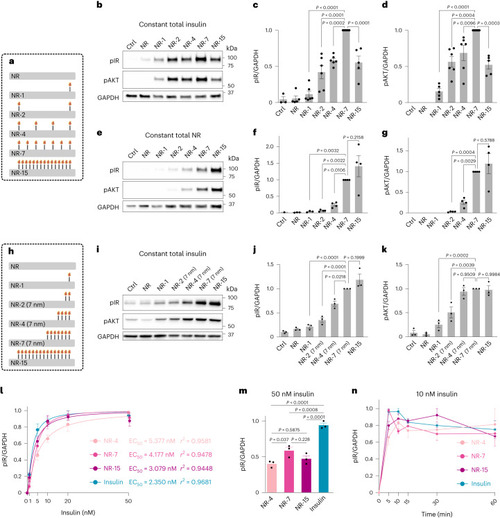
Valency and spacing of insulin on NanoRods determine IR pathway activation. a, Schematic of the NanoRods used in experiments (b–g and l–n). b–d, Western blot analysis (b) and the quantification of phosphorylated IR (pIR) (c) and phosphorylated AKT (pAKT) (d) levels in adipocytes treated with medium as controls (Ctrl) or with the indicated insulin NanoRods for 10 min. The total insulin concentration was kept constant at 10 nM. The values are presented as mean ± standard error of the mean (s.e.m.); n = 5 (NR-15) or n = 6 (remaining conditions) biologically independent samples. e–g, Western blot analysis (e) and the quantification of pIR (f) and pAKT (g) levels of adipocytes treated with medium (Ctrl) or with the indicated insulin NanoRods for 10 min. The total concentration of NanoRods was kept constant at 1 nM. The values are presented as mean ± s.e.m.; n = 4 biologically independent samples. h, Schematic of the NanoRods used in experiments (i–k). i–k, Western blot analysis (i) and the quantification of pIR (j) and pAKT (k) levels of adipocytes treated with medium (Ctrl) or with the indicated insulin NanoRods for 10 min. The total insulin concentration was kept constant at 10 nM. The values are presented as mean ± s.e.m.; n = 3 biologically independent samples. c,d,f,g,j,k, P values determined by one-way ANOVA followed by Dunnett’s multiple comparisons test. l, Quantification of pIR levels in adipocytes treated with increasing total insulin concentrations of NR-4, NR-7, NR-15 and unmodified insulin for 10 min. Data are plotted as normalized intensities relative to their highest and lowest values, for each condition. m, Quantification of pIR levels in adipocytes treated with 50 nM total insulin of NR-4, NR-7, NR-15 and unmodified insulin for 10 min. P values determined by one-way ANOVA followed by Dunnett’s multiple comparisons test. n, Quantification of pIR levels in adipocytes treated with 10 nM total insulin of NR-4, NR-7, NR-15 and unmodified insulin for 5, 10, 15, 30 and 60 min. Data are plotted as normalized intensities relative to their highest and lowest values, for each condition. The values in l–n are presented as mean ± s.e.m. for n = 3 biologically independent samples. The unmodified insulin used was purified similar to the NanoRods. Source data
|