
Fig. 6
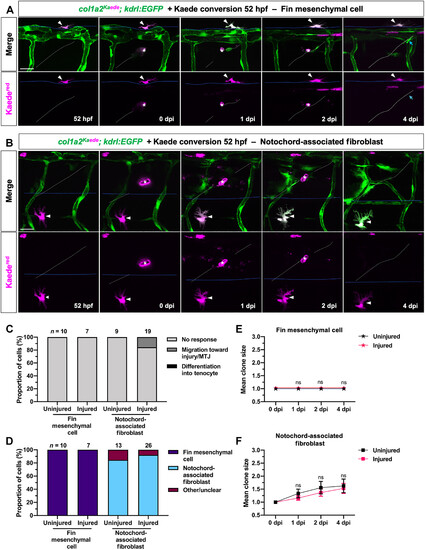
Fin mesenchymal cells and notochord-associated fibroblasts do not respond to tendon injury. (A and B) Clonal analysis of a single fin mesenchymal cell (A) and notochord-associated fibroblast (B) from 52 hpf to 4 dpi, as described in Fig. 4A. Both fibroblast subtypes (magenta, arrowheads) are retained within their respective anatomical locations after tendon injury. Blue lines indicate fin fold boundary in (A) and dorsal edge of the notochord in (B). The regenerating MTJ and injury site are indicated by white dotted lines and asterisks, respectively. Blue arrows in (A) indicate a newly regenerated Kaedered-negative tenocyte. (C to F) Quantification of fibroblast response (C), clonal composition (D), and clone size for fin mesenchymal cells (E) and notochord-associated fibroblasts (F) in injured versus uninjured embryos. Neither cell type showed notable activation after tendon injury. n = 10 (uninjured) and 7 (injured) fin mesenchymal cells; 9 (uninjured) and 19 (injured) notochord-associated fibroblasts. Data in (E) and (F) are shown as mean ± SEM. Statistics: Sidak’s multiple comparisons [(E) and (F)]. Significance: ns, P > 0.05. Scale bars, 25 μm. |