
Fig. 5
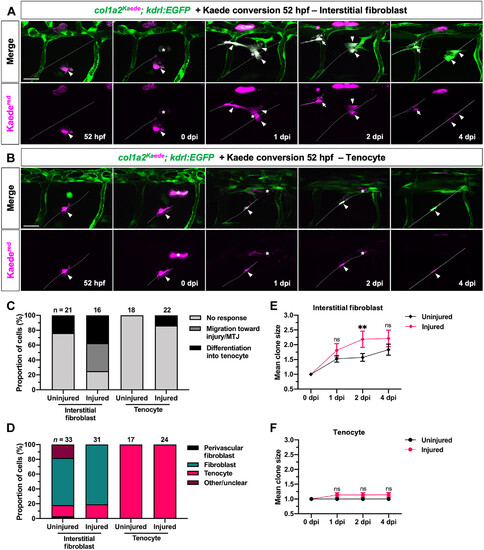
Interstitial fibroblasts but not tenocytes respond to tendon injury. (A and B) Representative images from clonal analysis of a single interstitial fibroblast (A) and tenocyte (B) in injured col1a2Kaede; kdrl:EGFP embryos, as described in Fig. 4A. The traced cells and their progeny (magenta) are indicated by arrowheads, and the new tenocyte is denoted by arrows. Dotted lines label MTJs, and injury site is denoted by asterisks in all images. (C to F) Quantification of interstitial fibroblast and tenocyte behavior, as depicted in Fig. 4B, showing overall response (C), clonal composition (D), and mean clone size [(E) and (F)] in injured and uninjured embryos. Note that the “differentiation into tenocyte” category for tenocyte clonal analysis graph in (C) represents rare cases where traced tenocytes underwent cell division to give rise to new tenocytes at the injured MTJ. n = 21 (uninjured) and 16 (injured) interstitial fibroblasts; 18 (uninjured) and 22 (injured) tenocytes. Data in (E) and (F) represented as mean ± SEM. Statistics: Sidak’s multiple comparisons [(E) and (F)]. Significance: ns, P > 0.05; **P < 0.01. Scale bars, 25 μm. |