
Fig. 7
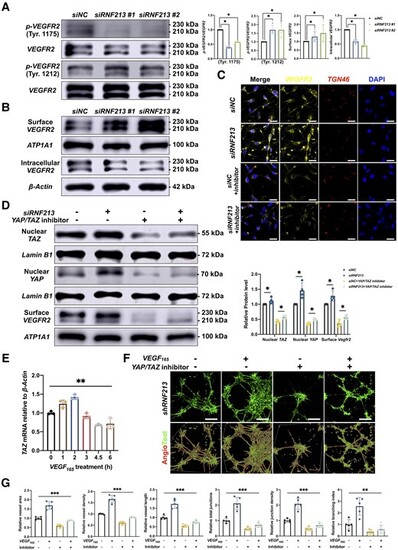
Inhibition of YAP/TAZ expression reverses RNF213-induced angiogenesis. (A) Quantitative analysis of the p-VEGFR2/VEGFR2 protein ratio in siNC- and siRNF213-treated HBMECs (Tyr.1175, n = 4, siNC versus siRNF213 #1 = 1.00 ± 0.00 versus 0.39 ± 0.03, P = 0.0286; siNC versus siRNF213 #2 = 1.00 ± 0.00 versus 0.57 ± 0.02, P = 0.0286; Tyr.1212, n = 4, siNC versus siRNF213 #1 = 1.00 ± 0.00 versus 1.69 ± 0.26, P = 0.0286; siNC versus siRNF213 #2 = 1.00 ± 0.00 versus 1.70 ± 0.37, P = 0.0286). (B) Quantitative analysis of surface and intracellular VEGFR2 protein levels between siNC- and siRNF213-treated HBMECs (surface VEGFR2, n = 4, siNC versus siRNF213 #1 = 1.00 ± 0.00 versus 1.28 ± 0.29, P = 0.0286; siNC versus siRNF213 #2 = 1.00 ± 0.00 versus 1.49 ± 0.50, P = 0.0286; intracellular VEGFR2, n = 4, siNC versus siRNF213 #1 = 1.00 ± 0.00 versus 0.59 ± 0.06, P = 0.0286; siNC versus siRNF213 #2 = 1.00 ± 0.00 versus 0.44 ± 0.04, P = 0.0286). (C) Analysis of the VEGFR2 protein distribution between siNC- and siRNF213-treated HBMECs. Scale bar = 20 µm. (D) Quantitative analysis of nuclear TAZ, nuclear YAP, and surface VEGFR2 protein levels in siNC-, siRNF213−, siNC+YAP/TAZ inhibitor-1−, and siRNF213+YAP/TAZ inhibitor-1-treated HBMECs (nuclear TAZ, n = 4, siNC versus siRNF213 = 1.00 ± 0.00 versus 1.11 ± 0.11, P = 0.0286; siNC+YAP/TAZ inhibitor-1 versus siRNF213+YAP/TAZ inhibitor-1 = 0.43 ± 0.05 versus 0.56 ± 0.06, P = 0.0286; nuclear YAP, n = 4, siNC versus siRNF213 = 1.00 ± 0.00 versus 1.46 ± 0.26, P = 0.0286; siNC+YAP/TAZ inhibitor-1 versus siRNF213+YAP/TAZ inhibitor-1 = 0.36 ± 0.03 versus 0.50 ± 0.04, P = 0.0286; surface VEGFR2, n = 4, siNC versus siRNF213 = 1.00 ± 0.00 versus 1.28 ± 0.17, P = 0.0286; siNC+YAP/TAZ inhibitor-1 versus siRNF213+YAP/TAZ inhibitor-1 = 0.36 ± 0.10 versus 0.56 ± 0.07, P = 0.0286). (E) Quantitative analysis of TAZ mRNA levels in normal HBMECs incubated with VEGF165 (5 ng/ml) at 0, 1, 2, 3, 4.5 and 6 h (n = 3, 1.00 ± 0.04 versus 1.24 ± 0.10 versus 1.42 ± 0.07 versus 0.92 ± 0.07 versus 0.68 ± 0.02 versus 0.72 ± 0.14, P = 0.0086, Kruskal–Wallis statistic =15.46). (F) A tube formation assay was conducted to measure angiogenesis in siRNF213-treated HBMECs after incubation with a YAP/TAZ inhibitor and/or VEGF165. Scale bar = 100 µm. (G) AngioTool software was used to automatically detect the vessel length and junctions. The siRNF213-transfected HBMECs treated with a YAP/TAZ inhibitor showed significant reductions in the vessel area (n = 6, 1.00 ± 0.07 versus 1.69 ± 0.21 versus 0.59 ± 0.08 versus 0.89 ± 0.03, P = 0.0005, Kruskal–Wallis statistic =17.58), vessel density (n = 6, 1.00 ± 0.02 versus 1.66 ± 0.17 versus 0.60 ± 0.07 versus 0.86 ± 0.03, P = 0.0005, Kruskal–Wallis statistic =17.86), vessel length (n = 6, 1.00 ± 0.41 versus 2.57 ± 0.76 versus 0.36 ± 0.20 versus 0.59 ± 0.34, P = 0.0044, Kruskal–Wallis statistic =13.09), total number of junctions (n = 6, 1.00 ± 0.15 versus 2.11 ± 0.40 versus 0.47 ± 0.11 versus 0.71 ± 0.15, P = 0.0007, Kruskal–Wallis statistic =16.91), junction density (n = 6, 1.00 ± 0.12 versus 2.08 ± 0.36 versus 0.48 ± 0.13 versus 0.69 ± 0.14, P = 0.0009, Kruskal–Wallis statistic =16.51), and branching index (n = 6, 1.00 ± 0.10 versus 1.73 ± 0.24 versus 0.54 ± 0.07 versus 0.77 ± 0.08, P = 0.0005, Kruskal–Wallis statistic =17.86) compared to those of siRNF213-transfected HBMECs treated with VEGF165. Each dot represents one sample. The means ± SDs are shown. The dashed line indicates the region of interest. *P < 0.05, **P < 0.01, ***P < 0.001, ****P < 0.0001. |