
Fig. 2
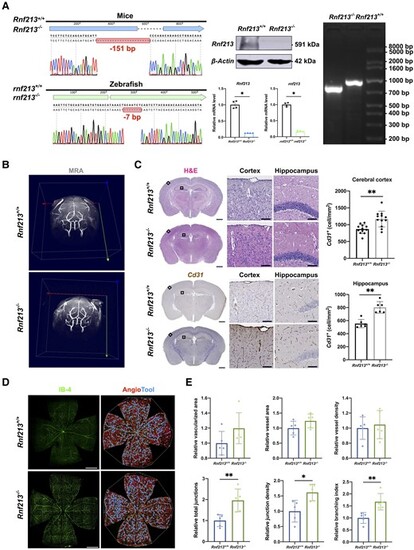
RNF213 deletion promotes pathological angiogenesis in vivo. (A) Sanger sequencing revealed a 151-bp deletion in mice and a 7-bp deletion in zebrafish. Western blots of mouse brain tissues validated an ∼90% decrease in Rnf213 expression in Rnf213−/− mice (n = 4, 1.00 ± 0.00 versus 0.07 ± 0.02, P = 0.0286). Quantitative RT-PCR confirmed the significantly reduced gene expression levels (Rnf213, n = 4, 1.00 ± 0.11 versus 0.13 ± 0.01, P = 0.0286; rnf213, n = 4, 0.99 ± 0.06 versus 0.17 ± 0.02, P = 0.0286). Agarose gel electrophoresis further confirmed this homozygous mutation in mice. (B) No significant differences in steno-occlusive arteries in the major branches of the Willis circle were observed between Rnf213+/+ and Rnf213−/− mice using 7.0 T magnetic resonance angiography. (C) The complete structure of the cerebral vessels was stained with haematoxylin and eosin (H&E) and subjected to immunohistochemistry. From each section, one similar region of the hippocampus and three similar cortical regions in the unilateral cerebral hemisphere were randomly selected. The Rnf213−/− mice showed a significantly increased vessel density in both the cerebral cortex (n = 12, 868.77 ± 133.61 versus 1167.60 ± 234.25 cell/mm2, P = 0.0011) and hippocampus (n = 6, 554.19 ± 63.98 versus 802.66 ± 88.41 cell/mm2, P = 0.0022). Scale bar = 1 mm (left); scale bar = 100 µm (right). (D) Vessels throughout the retinas from Rnf213+/+ and Rnf213−/− mice were labelled with IB-4. AngioTool software was used to automatically detect the vessel length (red) and junctions (blue). Scale bar = 500 µm. (E) No significant differences in the relative vascularized area (n = 5, 1.00 ± 0.16 versus 1.20 ± 0.21, P = 0.0952), vessel area (n = 5, 1.00 ± 0.23 versus 1.24 ± 0.23, P = 0.2222), and vessel density (n = 5, 1.00 ± 0.15 versus 1.05 ± 0.19, P > 0.9999) were observed between Rnf213+/+ and Rnf213−/− mice. Compared to Rnf213+/+ mice, Rnf213−/− mice showed significantly increased total junction numbers (n = 5, 1.00 ± 0.29 versus 1.96 ± 0.54, P = 0.0079), junction density (n = 5, 1.00 ± 0.35 versus 1.62 ± 0.27, P = 0.0159), and branch numbers (n = 5, 1.00 ± 0.25 versus 1.67 ± 0.34, P = 0.0079). Each dot represents one sample. The means ± SDs are shown. The dashed line indicates the region of interest. *P < 0.05, **P < 0.01, ***P < 0.001 and ****P < 0.0001. |