
Fig. 6
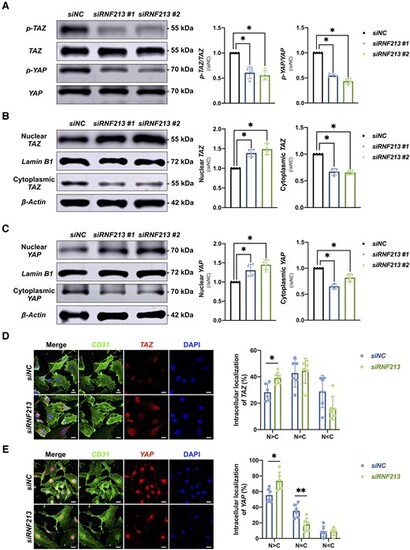
Endothelial RNF213 knockdown activates the Hippo effectors TAZ and YAP. (A) Quantitative analysis of p-TAZ/TAZ and p-YAP/YAP protein levels in siNC- and siRNF213-treated HBMECs (p-TAZ/TAZ, n = 4, siNC versus siRNF213 #1 = 1.00 ± 0.00 versus 0.61 ± 0.12, P = 0.0286; siNC versus siRNF213 #2 = 1.00 ± 0.00 versus 0.56 ± 0.09, P = 0.0286; p-YAP/YAP, n = 4, siNC versus siRNF213 #1 = 1.00 ± 0.00 versus 0.55 ± 0.03, P = 0.0286; siNC versus siRNF213 #2 = 1.00 ± 0.00 versus 0.43 ± 0.05, P = 0.0286). (B) Quantitative analysis of nuclear (N) and cytoplasmic (C) TAZ protein levels in siNC- and siRNF213-treated HBMECs at the nuclear and cytoplasmic levels (nuclear TAZ, n = 4, siNC versus siRNF213 #1 = 1.00 ± 0.00 versus 1.39 ± 0.09, P = 0.0286; siNC versus siRNF213 #2 = 1.00 ± 0.00 versus 1.49 ± 0.14, P = 0.0286; cytoplasmic TAZ, n = 4, siNC versus siRNF213 #1 = 1.00 ± 0.00 versus 0.67 ± 0.06, P = 0.0286; siNC versus siRNF213 #2 = 1.00 ± 0.00 versus 0.66 ± 0.04, P = 0.0286). (C) Quantitative analysis of nuclear and cytoplasmic YAP protein levels in siNC- and siRNF213-treated HBMECs at the nuclear and cytoplasmic levels (nuclear YAP, n = 4, siNC versus siRNF213 #1 = 1.00 ± 0.00 versus 1.31 ± 0.16, P = 0.0286; siNC versus siRNF213 #2 = 1.00 ± 0.00 versus 1.45 ± 0.13, P = 0.0286; cytoplasmic YAP, n = 4, siNC versus siRNF213 #1 = 1.00 ± 0.00 versus 0.65 ± 0.04, P = 0.0286; siNC versus siRNF213 #2 = 1.00 ± 0.00 versus 0.82 ± 0.07, P = 0.0286). (D) Analysis of the difference in the distribution of TAZ protein expression between siNC- and siRNF213-treated HBMECs (N > C, n = 6, 28.30 ± 6.42 versus 39.16 ± 4.33%, P = 0.0152; N = C, n = 6, 42.83 ± 10.61 versus 44.55 ± 9.51%, P > 0.9999; N < C, n = 6, 28.87 ± 12.25 versus 16.29 ± 8.89%, P = 0.0931). Scale bar = 20 µm. (E) Analysis of the difference in the distribution of YAP protein expression between siNC- and siRNF213-treated HBMECs (N > C, n = 6, 55.42 ± 8.72 versus 73.75 ± 11.09%, P = 0.0152; N = C, n = 6, 35.34 ± 8.67 versus 17.87 ± 8.22%, P = 0.0087; N < C, n = 6, 9.25 ± 6.78 versus 8.39 ± 4.71%, P = 0.7879). Scale bar = 20 µm. Each dot represents one sample. The means ± SDs are shown. The dashed line indicates the region of interest. *P < 0.05, **P < 0.01, ***P < 0.001, ****P < 0.0001. |