
FIGURE
Figure 4
- ID
- ZDB-FIG-240202-28
- Publication
- Kim et al., 2024 - Protocol for image-based small-molecule screen to identify neuroprotective compounds for dopaminergic neurons in zebrafish
- Other Figures
- All Figure Page
- Back to All Figure Page
Figure 4
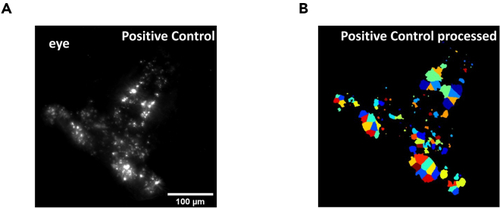
DA neuron isolation and fluorescence intensity analysis Example steps in the CellProfiler pipeline that highlights the identification of TH neurons based on the pixel size. (A) Using the 20x bright field image to overlay the fluorescent image to automatically detect the eyes for removal of autofluorescence. (B) The “IdentifyPrimaryObjects” command with the global threshold strategy configurations correctly capture the neurons that are later used to quantify intensity. |
Expression Data
Expression Detail
Antibody Labeling
Phenotype Data
Phenotype Detail
Acknowledgments
This image is the copyrighted work of the attributed author or publisher, and
ZFIN has permission only to display this image to its users.
Additional permissions should be obtained from the applicable author or publisher of the image.
Full text @ STAR Protoc