FIGURE

Figure 5

ID
ZDB-FIG-240129-234
Publication
Hamm et al., 2024 - Interlaboratory Study on Zebrafish in Toxicology: Systematic Evaluation of the Application of Zebrafish in Toxicology's (SEAZIT's) Evaluation of Developmental Toxicity
Other Figures
All Figure Page
Back to All Figure Page
Figure 5

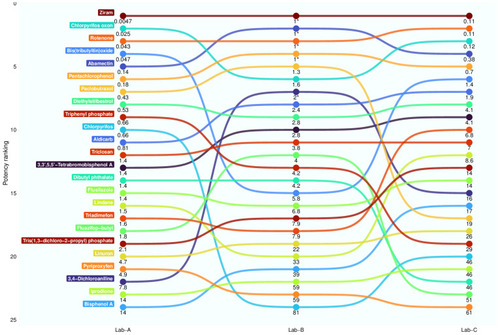
Comparison of potency for 24 test substances active at all laboratories. The bump chart is based on potency ranking of substances that produced phenotypic alterations or mortality (the MalformedAny+Mort@120 endpoint) at each study laboratory. The value presented below each circle represents the median BMC for that test substance within a laboratory. A line was drawn connecting the median BMCs for each test substance within the three laboratories. Each test substance was randomly given a different color to assist with differentiating between test substances. An “*” next to a BMC value indicates that the BMC reflects the lowest test concentration, and the substance would need to be retested at lower concentrations to generate a more accurate BMC.

Expression Data

Expression Detail
Antibody Labeling
Phenotype Data

Phenotype Detail
Acknowledgments
This image is the copyrighted work of the attributed author or publisher, and ZFIN has permission only to display this image to its users. Additional permissions should be obtained from the applicable author or publisher of the image. Full text @ Toxics