FIGURE SUMMARY
Title

Interlaboratory Study on Zebrafish in Toxicology: Systematic Evaluation of the Application of Zebrafish in Toxicology's (SEAZIT's) Evaluation of Developmental Toxicity

Authors
Hamm, J.T., Hsieh, J.H., Roberts, G.K., Collins, B., Gorospe, J., Sparrow, B., Walker, N.J., Truong, L., Tanguay, R.L., Dyballa, S., Miñana, R., Schiavone, V., Terriente, J., Weiner, A., Muriana, A., Quevedo, C., Ryan, K.R.
Source
Full text @ Toxics

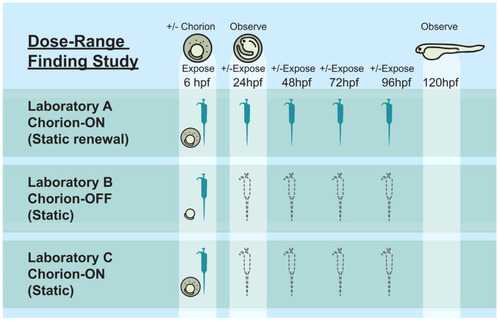
DRF study overview. Schematic representation of the DRF study. Embryos were exposed at 6 h post fertilization (hpf) and, in the case of static renewal, at 24, 48, 72, and 96 h post fertilization (hpf) after the initial exposure. Lab A used chorionated embryos and renewed dosing solutions every 24 h (DRF_Lab A_SR-C). Lab B removed the chorion and used static exposure (DRF_Lab B_S-DC). Lab C used static exposure of chorionated embryos (DRF_Lab C_S-C).

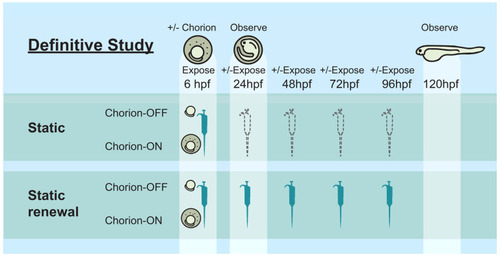
Definitive study overview. Schematic representation of the Def study. The three laboratories participating in the study exposed embryos under four exposure conditions, including static exposure, renewal of exposure media every 24 h, using both chorionated and dechorionated embryos.

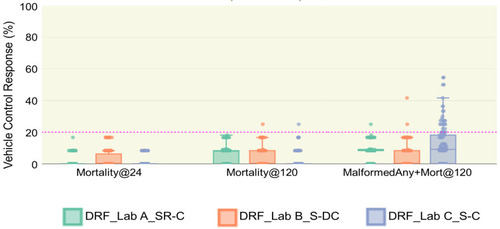
Mortality and altered phenotypes for vehicle-control-exposed embryos. The distribution response (%) of three endpoints (Mortality@24, Mortality@120, MalformedAny+Mort@120) was calculated based on the response (%) from vehicle-control-treated embryos on each plate. The pink horizontal line at 20% represents the upper bound for mortality that is considered acceptable. Each dot represents a plate. The total number of plates per laboratory is 123. The background data are provided in Supplemental Table S5a, and statistics of boxplots are available in Supplemental Table S5b.

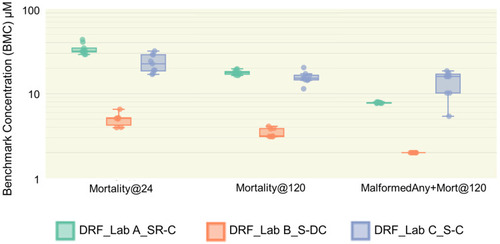
Distribution of BMCs for the positive-control-exposed embryos. The distribution of BMCs for three endpoints (Mortality@24, Mortality@120, MalformedAny+Mort@120) was calculated based on the BMC from positive-control-treated embryos on each plate. Each dot represents a BMC derived from the positive control data pooled weekly. N = 10 (Lab A), 7 (Lab B), 9 (Lab C). The background data are provided in Supplemental Table S6a, and statistics of boxplots are available in Supplemental Table S6b.

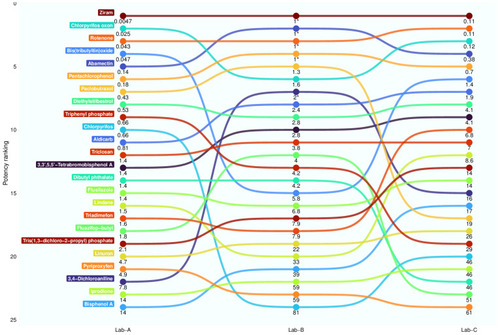
Comparison of potency for 24 test substances active at all laboratories. The bump chart is based on potency ranking of substances that produced phenotypic alterations or mortality (the MalformedAny+Mort@120 endpoint) at each study laboratory. The value presented below each circle represents the median BMC for that test substance within a laboratory. A line was drawn connecting the median BMCs for each test substance within the three laboratories. Each test substance was randomly given a different color to assist with differentiating between test substances. An “*” next to a BMC value indicates that the BMC reflects the lowest test concentration, and the substance would need to be retested at lower concentrations to generate a more accurate BMC.

Acknowledgments
This image is the copyrighted work of the attributed author or publisher, and ZFIN has permission only to display this image to its users. Additional permissions should be obtained from the applicable author or publisher of the image. Full text @ Toxics