
FIGURE
Figure 3
- ID
- ZDB-FIG-240129-232
- Publication
- Hamm et al., 2024 - Interlaboratory Study on Zebrafish in Toxicology: Systematic Evaluation of the Application of Zebrafish in Toxicology's (SEAZIT's) Evaluation of Developmental Toxicity
- Other Figures
- All Figure Page
- Back to All Figure Page
Figure 3
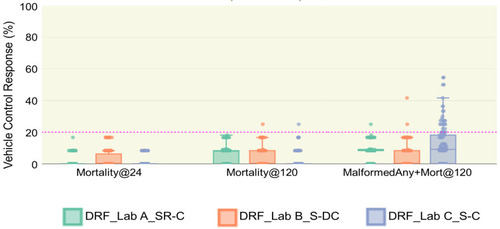
Mortality and altered phenotypes for vehicle-control-exposed embryos. The distribution response (%) of three endpoints ( |
Expression Data
Expression Detail
Antibody Labeling
Phenotype Data
Phenotype Detail
Acknowledgments
This image is the copyrighted work of the attributed author or publisher, and
ZFIN has permission only to display this image to its users.
Additional permissions should be obtained from the applicable author or publisher of the image.
Full text @ Toxics