|
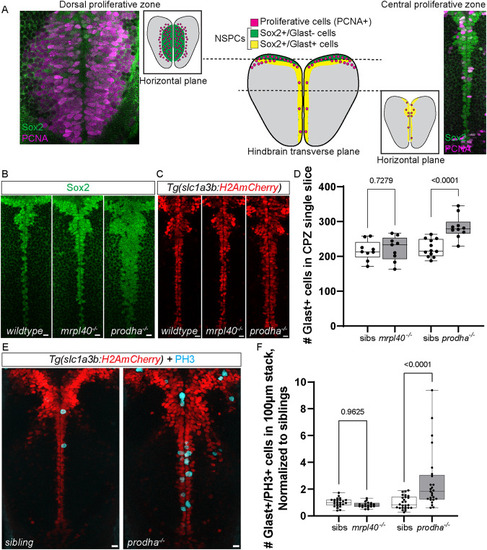
prodha mutant NSPCs in the central proliferative zone are expanded and hyperproliferative. A Diagram depicting NSPC populations in the zebrafish hindbrain at 5dpf. Transverse plane view shows highly proliferative NSPCs (Sox2+/Glast−) and committed progenitors/neuroblasts (Sox−/Glast−) located dorsally (Dorsal proliferative zone inset) and less proliferative NSPCs (Sox2+/Glast+) located centrally (Central proliferative zone inset). Insets are horizontal plane view. B–D Sox2 antibody staining (B) and Tg(slc1a3b:H2AmCherry) labeling (C) in central proliferative zone in wildtypes, mrpl40 mutants, and prodha mutants. Wildtypes and mrpl40 mutants display similar patterns whereas prodha mutants have an expanded Sox2+ and Glast+ domain. Images are single confocal slices. Scale bars 10 μm. Quantification shows increased number of Glast+ cells in prodha mutants (D). Unpaired two-way Student’s t test, p-values are displayed on the plots. mrpl40 mutants (n = 9) and siblings (n = 9). prodha mutants (n = 10) and siblings (n = 12) from two biological replicates. E, F PH3 staining in central proliferative zone in siblings, mrpl40 mutants, and prodha mutants. prodha mutants show an increased number of Glast+/PH3+ cells compared to siblings (F). Unpaired two-way Student’s t test, p-values displayed on the plots. Images are maximum projections from confocal stacks. Scale bars 10 μm. mrpl40 mutants (n = 19) and siblings (n = 25). prodha mutants (n = 25) and siblings (n = 26) from four biological replicates.
|