|
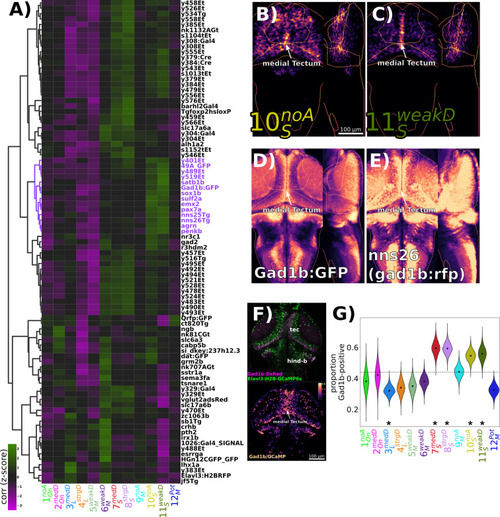
Identification of GABAergic neuronal classes. (A) Hierarchically clustered heatmap depicting the correlation of markers aligned to the Z-Brain atlas with the spatial arrangement of the 12 functional clusters (distance = complete, correlation). Correlation values are z-scored by rows to highlight the cluster(s) most strongly correlated or anti-correlated with a given marker. The subset of the hierarchy containing the gad1b-reporters is coloured in purple. (B–D) Normalized summed intensity projections of (B) 10SnoA, (C) 11SweakD, (D) TgBAC(gad1b:GFP) (Satou et al., 2013), Z-Brain Atlas, and (E) nns26, aka TgBAC(gad1b:LOXP-RFP-LOXP-GFP) (Satou et al., 2013), mapZebrain Atlas. (F) Two-photon imaging of Tg(Gad1b:DsRed);Tg(elavl3:H2B-GCaMP6s) larvae depicting the raw data for each channel (top), and the ratio of Gad1b/GCaMP6s fluorescence in each ROI functionally identified using suite2p. (G) ROIs imaged in double transgenic larvae are assigned a cluster identity based on their correlation to the cluster mean trace and classified as Gad1b-positive based on a DsRed/GCaMP6s ratio of greater than 0.25. Dotted line = expected proportion based on total number of cells classified as Gad1b-positive. *p<0.05, Chi-square test with Bonferroni correction. Distributions for violin plots calculated by bootstrapping 5000 replicates. n = 1835 ROIs in six larvae.
|