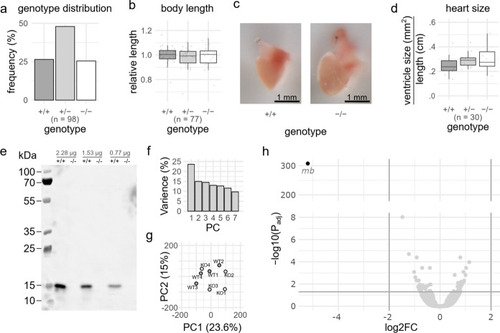
Characterization of adult (3–6 months post fertilization) mbAuzf13.2 zebrafish resulting from in-crossed mbAuzf13.2(±). a Genotype frequency distribution. Using an X2-test, no statistically significant deviation from the expected Mendelian distribution (X2 = 0.18367, df = 2, p = 0.9123) was found. b Zebrafish length relative to mean length of mbAuzf13.2(+/+) siblings. Using a one-way ANOVA test, no statistically significant difference in length according to genotype (F(2) = .474, p = 0.624) was found. c Adult hearts from wild-type and knockout (mbAuzf13.2(−/−)) fish. d Ventricle size measured by its cross section. Using a one-way ANOVA test, no statistically significant difference in ventricle cross section area normalized to standard length when comparing genotypes (F(2) = 1.12, p = 0.341) was found. e Mb specific western blot of heart homogenate from the mbAuzf13.2 with the wild-type (+ / +) and knockout (−/ −) genotype. Three different protein amounts (left to right: 2.28, 1.53, and 0.765 µg) of total protein were loaded. Principal component (PC) analysis of gene counts from RNA sequencing comparing knockout vs. wild-type zebrafish heart ventricles. f Scree plot for all PCs. g Plot of PC1 and PC2. h Volcano plot depicting log2 fold change (FC) in expression and the − log10(Padj) values. Horizontal grey line indicated a Padj value of 0.05. The vertical line depict log2FC of − 2 and 2
|
