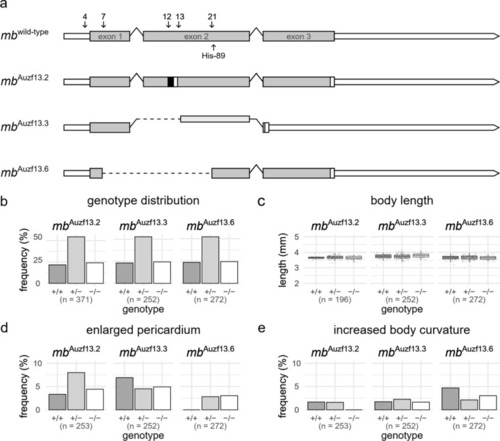
Generated myoglobin (mb) knockout lines, embryonic body length and genotype distribution. a Schematic representation of the zebrafish mb gene (top) and the three variants generated in this study. Exons are shown as grey bars, introns as black lines, and stop codon and UTR are white bars. The positions of guide RNAs and His-89 are indicated by numbered arrows and text, respectively. For generation of the mbAuzf13.2 and the mbAuzf13.6 lines, gRNAs 4, 7, 12, and 21 were used. For generation of the mbAuzf13.2 gRNA 13 was used. Insertions are shown as a black bar in mbAuzf13.2. Deletions are shown as dotted lines in mbAuzf13.3 and mbAuzf13.6. b Genotype frequency at 6 dpf from F2 or F3 mb(±) in-crosses. Using an X2-test, no statistically significant deviation from the expected Mendelian distribution in mbAuzf13.2 (X2 = 3.372, df = 2, p = 0.1853), mbAuzf13.3 (X2 = 0.84921, df = 2, p = 0.654) or mbAuzf13.6 (X2 = 0.55882, df = 2, p = 0.7562) was found. c Length measurements of the three KO lines at 6 dpf from F2 or F3 mb(/-) in-crosses. Using a one-way ANOVA test, no statistically significant difference in average length according to genotype for mbAuzf13.2 (F(2) = 1.012, p = 0.366), mbAuzf13.3 (F(2) = 1.932, p = 0.147) or mbAuzf13.6 (F(2) = 0.128, p = 0.879) was found. d Frequency of enlarged pericardium at 6 dpf from F2 or F3 mb(/-) in-crosses. Using a Fisher’s exact test, no statistically significant difference in occurrence of enlarged pericardium in mbAuzf13.2 (p = 0.4747), mbAuzf13.3 (p = 0.7556), or mbAuzf13.6 (p = 0.5524) was found. e Frequency of deviation from normal body curvature. Using a Fisher’s exact test, no statistically significant deviation from normal body curvature in mbAuzf13.2 (p = 0.6126), mbAuzf13.3 (p = 0.6126), or mbAuzf13.6 (p = 0.5794) was found
|
