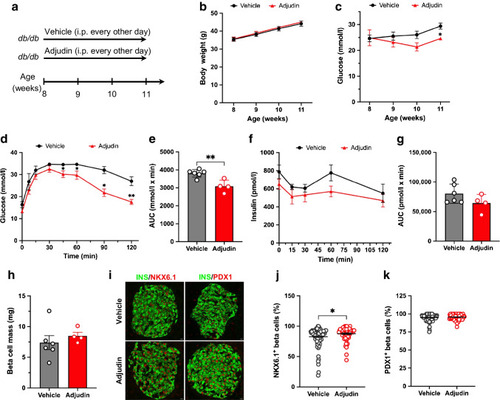
Adjudin improves glucose homeostasis in db/db mice. (a) Schematic of the in vivo study using 8-week-old male db/db mice. The mice received intraperitoneal injections of vehicle (n=6) or 50 mg/kg adjudin (n=4) every other day for 3 weeks. Body weight and nonfasting glucose were measured weekly. IPGTT and histological examination were performed at the end of the treatment. (b) Weekly body weight of the db/db mice. Student’s t test. Data are presented as mean ± SEM. (c) Weekly nonfasting blood glucose of the db/db mice. Student’s t test: *p<0.05 vs vehicle. Data are presented as mean ± SEM. (d) IPGTT. Student’s t test: *p<0.05, **p<0.01 vs vehicle. Data are presented as mean ± SEM. (e) AUC of the IPGTT. Student’s t test: **p<0.01. Data are presented as mean ± SEM. (f) Intraperitoneal glucose stimulated insulin secretion (IPGSIS). Blood insulin levels in the IPGTT experiment. Student’s t test. Data are presented as mean ± SEM. (g) AUC curve of the IPGSIS. Student’s t test. Data are presented as mean ± SEM. (h) Pancreatic beta cell mass in vehicle- and adjudin-treated db/db mice. Student’s t test. Data are presented as mean ± SEM. (i) Immunofluorescence staining of insulin (INS), NKX6.1 and PDX1 in pancreas from vehicle- and adjudin-treated db/db mice. Scale bar, 10 µm. (j) Quantification of the percentage of insulin-positive cells expressing NKX6.1 per islet. Student’s t test. *p<0.05. n=101 islets (vehicle), n=67 islets (adjudin). Data are presented as mean ± SEM. (k) Quantification of the percentage of insulin-positive cells expressing PDX1 per islet. Student’s t test. n=90 islets (vehicle), n=65 islets (adjudin). Data are presented as mean ± SEM
|
