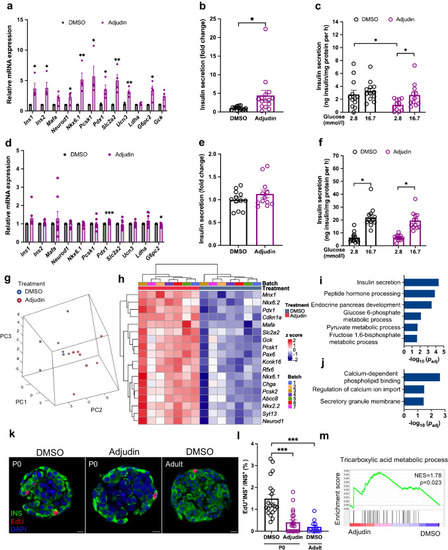
Adjudin improves the function of neonatal mouse islets. (a) qPCR analysis of the expression of beta cell maturation markers in P0 islets. P0 islets were cultured in medium containing 11 mmol/l glucose and treated with DMSO or 10 µmol/l adjudin for 1 day before qPCR. Student’s t test: *p<0.05, **p<0.01 vs DMSO. n=4 per treatment. Data are presented as mean ± SEM. (b) Accumulated insulin secretion by P0 islets. P0 islets were cultured in medium containing 11 mmol/l glucose and treated with DMSO or 10 µmol/l adjudin for 1 day. Culture medium was collected at the end of the treatment to analyse insulin levels. Student’s t test: *p<0.05. n=15 per treatment. Data are presented as mean ± SEM. (c) GSIS of P0 islets. P0 islets were cultured in medium containing 11 mmol/l glucose and treated with DMSO or 10 µmol/l adjudin for 1 day before GSIS. Student’s t test: *p<0.05. n=12 (DMSO), n=11 (adjudin). Data are presented as mean ± SEM. (d) qPCR analyses of the expression of beta cell maturation markers in adult islets. Adult islets were cultured in medium containing 11 mmol/l glucose and treated with DMSO or 10 µmol/l adjudin for 1 day before qPCR. Student’s t test: *p<0.05, ***p<0.001 vs DMSO. n=8 per treatment. Data are presented as mean ± SEM. (e) Accumulated insulin secretion by adult islets. Adult islets were cultured in medium containing 11 mmol/l glucose and treated with DMSO or 10 µmol/l adjudin for 1 day. Culture medium was collected at the end of the treatment to analyse insulin levels. Student’s t test. n=12 per treatment. Data are presented as mean ± SEM. (f) GSIS of adult islets. Adult islets were cultured in medium containing 11 mmol/l glucose and treated with DMSO or 10 µmol/l adjudin for 1 day before GSIS. Student’s t test: *p<0.05. n=12 per treatment. Data are presented as mean ± SEM. (g) 3D PCA plot for P0 islets. (h) Heatmap of significantly upregulated genes related to beta cell function in P0 islets after adjudin treatment, the scale represents z score. (i, j) GO terms associated with upregulated genes after adjudin treatment in P0 islets. (i) GO terms related to beta cell development and function and glucose metabolism. (j) GO terms related to downstream signalling of GSIS. (k) Representative immunofluorescence images from whole mount staining of mouse islets to assess proliferation. Islets were cultured in medium containing 11 mmol/l glucose and treated with DMSO or 10 µmol/l adjudin for 1 day. A final concentration of 20 µmol/l EdU was used for 2 h of incubation at the end of the treatment. Scale bar, 10 µm. (l) Quantification of percentage of proliferative beta cells in (k). One-way ANOVA with Tukey’s multiple comparisons test: ***p<0.001. n=20 (P0, DMSO), n=21 (P0, adjudin), n=12 (adult, DMSO). Data are presented as mean ± SEM. (m) GSEA plot showing gene sets related to ‘tricarboxylic acid metabolic process’. INS, insulin; NES, normalised enrichment score; PC1, principal component 1; PC2, principal component 2; PC3, principal component 3
|
