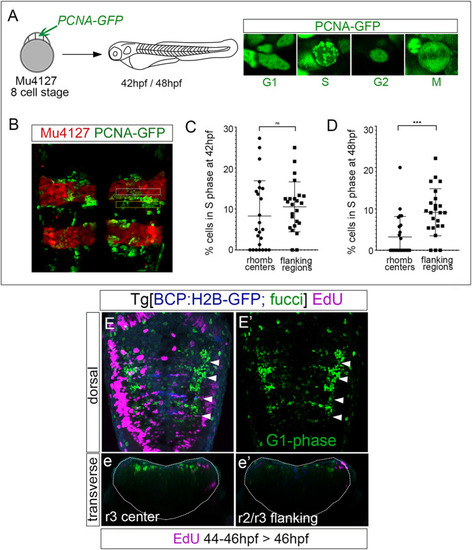
Rhombomere centers harbor G1-phase-arrested progenitors. (A) Scheme depicting the experimental design of the in vivo PCNA-GFP clonal analysis. Mu4127 embryos displaying mCherry in r3 and r5 were injected with PCNA-GFP at the 8-cell stage, and hindbrains were analyzed at 42 hpf and 48 hpf. Images show examples of the different distributions of PCNA-GFP within the cell nuclei along the cell cycle phases. (B) Example of the hindbrain of Mu4127 embryos injected with PCNA-GFP used for quantification analysis. Rhombomere centers and boundary-flanking regions used for quantification are framed in white and yellow, respectively. (C,D) Graphs illustrating the percentage of cells in the S-phase in rhombomere centers and boundary-flanking regions at 42 hpf and 48 hpf, respectively. S-phase cells at 42 hpf: 8.2% in rhombomere centers vs. 10.5% in boundary-flanking regions. S-phase cells at 48 hpf: 3.2% in rhombomere centers vs. 9.1% in boundary-flanking regions. Wilcoxon test analysis is shown: ns, non-significant, ***p < 0.001, N = 4 embryos, n = 24 boundaries, n = 24 flanking regions. (E,E’) Double transgenic Tg[BCP:H2B-GFP; fucci] embryos were incubated with EdU for 2 h and analyzed at 46 hpf. Boundaries are depicted in blue, G1-phase cells in green, and EdU-positive cells in magenta. Note that G1-phase cells are mainly located in the center of the rhombomeres and did not incorporate EdU. Dorsal MIP with anterior to the top displaying a merge of channels (E) and only G1-phase cells in the green channel (E’). White arrowheads indicate the rhombomere boundaries. (e,e’) Transverse views of (E) at the level of the r3 center and r2/r3 flanking region, respectively. Dotted lines in (e,e’) indicate the contour of the neural tube.
|
