IMAGE

FIGURE 3

ID
ZDB-IMAGE-231130-54
Source
Figures for Belmonte-Mateos et al., 2023
Image
Figure Caption

FIGURE 3

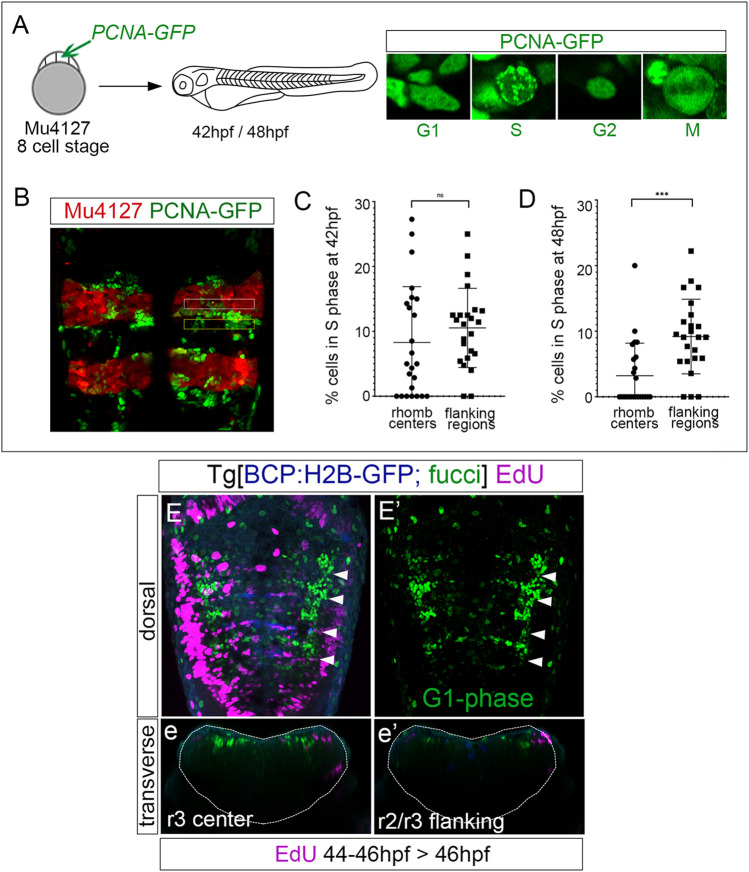
Rhombomere centers harbor G1-phase-arrested progenitors. (A) Scheme depicting the experimental design of the in vivo PCNA-GFP clonal analysis. Mu4127 embryos displaying mCherry in r3 and r5 were injected with PCNA-GFP at the 8-cell stage, and hindbrains were analyzed at 42 hpf and 48 hpf. Images show examples of the different distributions of PCNA-GFP within the cell nuclei along the cell cycle phases. (B) Example of the hindbrain of Mu4127 embryos injected with PCNA-GFP used for quantification analysis. Rhombomere centers and boundary-flanking regions used for quantification are framed in white and yellow, respectively. (C,D) Graphs illustrating the percentage of cells in the S-phase in rhombomere centers and boundary-flanking regions at 42 hpf and 48 hpf, respectively. S-phase cells at 42 hpf: 8.2% in rhombomere centers vs. 10.5% in boundary-flanking regions. S-phase cells at 48 hpf: 3.2% in rhombomere centers vs. 9.1% in boundary-flanking regions. Wilcoxon test analysis is shown: ns, non-significant, ***p < 0.001, N = 4 embryos, n = 24 boundaries, n = 24 flanking regions. (E,E’) Double transgenic Tg[BCP:H2B-GFP; fucci] embryos were incubated with EdU for 2 h and analyzed at 46 hpf. Boundaries are depicted in blue, G1-phase cells in green, and EdU-positive cells in magenta. Note that G1-phase cells are mainly located in the center of the rhombomeres and did not incorporate EdU. Dorsal MIP with anterior to the top displaying a merge of channels (E) and only G1-phase cells in the green channel (E’). White arrowheads indicate the rhombomere boundaries. (e,e’) Transverse views of (E) at the level of the r3 center and r2/r3 flanking region, respectively. Dotted lines in (e,e’) indicate the contour of the neural tube.

Acknowledgments
This image is the copyrighted work of the attributed author or publisher, and ZFIN has permission only to display this image to its users. Additional permissions should be obtained from the applicable author or publisher of the image. Full text @ Front Cell Dev Biol