
Fig. 2
- ID
- ZDB-FIG-231128-23
- Publication
- Pownall et al., 2023 - Chromatin expansion microscopy reveals nanoscale organization of transcription and chromatin
- Other Figures
- All Figure Page
- Back to All Figure Page
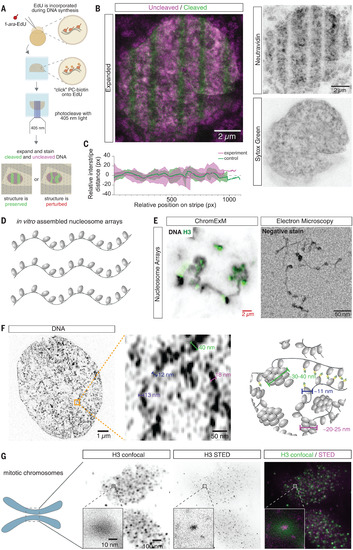
ChromExM preserves chromatin architecture and resolves chromatin fibers and individual nucleosomes. (A) Schematic that shows how the chromatin is painted with photocleaved (PC) stripes to detect perturbations after expansion. (B) Expanded nucleus that shows that PC stripes remain parallel and sharp after expansion. The image is a maximum intensity projection of several z-slices. n = 20 nuclei from 3 embryos. (C) Quantification of relative interstripe distance in PC stripes versus a simulated control (methods) shows minimal variation in the spacing between stripes after expansion. n = 3 nuclei from 3 embryos. (D) Schematic of in vitro–assembled nucleosome arrays. (E) ChromExM image (left) that shows nucleosome arrays with H3 staining and EM image of nucleosome arrays with a similar conformation as the expanded array. Red scale bar is not corrected for the expansion factor. (F) ChromExM image with metabolic DNA labeling at 2.75 hpf that shows individual chromatin fibers and a schematic of chromatin. n = 6 nuclei, 5 embryos. (G) H3 staining imaged with confocal and STED microscopy resolves individual nucleosomes. n = 468 nucleosomes; 3 nuclei from 2 embryos. |