
- Title
-
Chromatin expansion microscopy reveals nanoscale organization of transcription and chromatin
- Authors
- Pownall, M.E., Miao, L., Vejnar, C.E., M'Saad, O., Sherrard, A., Frederick, M.A., Benitez, M.D.J., Boswell, C.W., Zaret, K.S., Bewersdorf, J., Giraldez, A.J.
- Source
- Full text @ Science

Nanog forms DNA-bound foci associated with zygotic transcription. (A) Schematic that details how Nanog and miR-430 transcription were visualized in living embryos. eGFP, enhanced green fluorescent protein. (B) Live imaging shows Nanog foci associated with miR-430 transcription at 2.5 hpf. n = 10 nuclei. (C) Live imaging shows Nanog foci are formed and disappear before Pol II elongation at = 2.75 hpf. n = 2 nuclei, 1 embryo. (D) Quantification of fluorescence intensity in (C). a.u., arbitrary unit. (E) Schematic that shows the process of ChromExM and expected results. AA, acrylamide; BIS, N,N′-methylenebis(acrylamide); DHEBA, N,N′-(1,2-dihydroxyethylene)bisacrylamide; EU, 5-ethynyl uridine; SA, sodium acrylate. (F) Unexpanded and expanded nuclei from two unrelated embryos stained for DNA and imaged with a 10× 0.3 numerical aperture (NA) objective demonstrate the enhanced resolution provided by ChromExM. Scale bar is not corrected for the expansion factor. (G) Quantification of the nuclear expansion factor determined by measuring the nuclear cross-sectional area. n = 171 unexpanded nuclei from 3 embryos and 104 expanded nuclei from 17 embryos. |
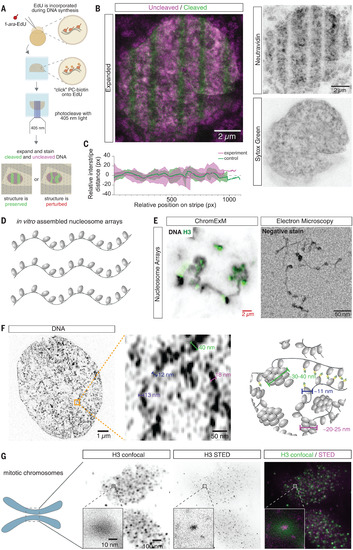
ChromExM preserves chromatin architecture and resolves chromatin fibers and individual nucleosomes. (A) Schematic that shows how the chromatin is painted with photocleaved (PC) stripes to detect perturbations after expansion. (B) Expanded nucleus that shows that PC stripes remain parallel and sharp after expansion. The image is a maximum intensity projection of several z-slices. n = 20 nuclei from 3 embryos. (C) Quantification of relative interstripe distance in PC stripes versus a simulated control (methods) shows minimal variation in the spacing between stripes after expansion. n = 3 nuclei from 3 embryos. (D) Schematic of in vitro–assembled nucleosome arrays. (E) ChromExM image (left) that shows nucleosome arrays with H3 staining and EM image of nucleosome arrays with a similar conformation as the expanded array. Red scale bar is not corrected for the expansion factor. (F) ChromExM image with metabolic DNA labeling at 2.75 hpf that shows individual chromatin fibers and a schematic of chromatin. n = 6 nuclei, 5 embryos. (G) H3 staining imaged with confocal and STED microscopy resolves individual nucleosomes. n = 468 nucleosomes; 3 nuclei from 2 embryos. |

Visualizing the nanoscale organization of Nanog, nucleosomes, Pol II, and transcription. (A to D) Representative images showing Nanog and H3 staining at 4 hpf; (B) represents class 1 organization. (C) represents the white boxed region in (A) and shows class 2 organization. (D) represents the green boxed region in (A) and shows class 3 organization. n = 3 nuclei from 2 embryos. (E to G) Box plots quantifying the percentage of H3 particles in each class of Nanog–H3 interactions. The median is denoted by the orange line. n = 104,347 distances. (H to K) Representative images showing Nanog and Pol II pSer5 staining at 4 hpf, n = 7 nuclei from 2 embryos. (I) represents the green boxed region in (H) and shows class 1 organization; areas indicated with arrowheads are magnified to the right. (J) represents class 2 organization. (K) represents the magenta boxed region in (H) and shows class 3 organization; arrowheads indicate regions enriched for Nanog (open arrowhead) and Pol II pSer5 (closed arrowhead). (L) Density plot of the distance to nearest neighbor for Nanog and Pol II pSer5 particles; n = 169,866 distances. (M) Box plots quantifying the number of Pol II pSer5 particles in class 1 (n = 36) and class 2 (n = 5682) strings. (N) Box plots quantifying the number of Nanog particles in class 1 and class 2 Pol II pSer5 strings. (O) Box plots quantifying the length of Pol II pSer5 strings in class 1 and class 2. (P and Q) ChromExM images showing Pol II pSer5 and miR-430 RNA detected by hybridization chain reaction RNA FISH at 4 hpf. (Q) represents the boxed region in (P). (R to U) Representative images showing nascent RNA and Pol II pSer5 at 4 hpf. n = 7 nuclei from 3 embryos. The closed arrowhead in (R) indicates a central Pol II pSer5 hub with an emanating string of individual Pol II pSer5 particles associated with nascent transcripts (open arrowhead). Open arrowheads in (S) indicate individual Pol II pSer5 particles. |
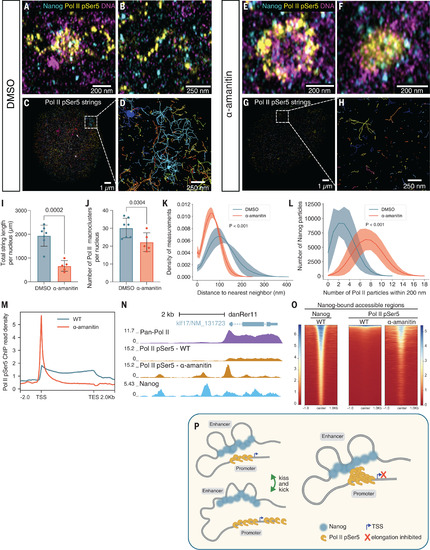
Nanog-bound enhancers and Pol II-bound promoters are kicked apart by transcription elongation. (A and B) Representative images of Nanog and Pol II pSer5 in dimethyl sulfoxide (DMSO)–treated embryos at 4 hpf. n = 6 nuclei from 2 embryos. (C and D) Visualization of Pol II pSer5 strings identified in DMSO-treated embryos at 4 hpf. (E and F) Representative images of Nanog and Pol II pSer5 in α-amanitin–treated embryos. (G and H) Visualization of Pol II pSer5 strings identified in α-amanitin–treated embryos. (I) Quantification of total Pol II pSer5 string length per nucleus in DMSO- and α-amanitin–treated embryos. P = 0.0002; unpaired t test. (J) Quantification of the number of Pol II pSer5 macroclusters detected in DMSO- and α-amanitin–treated embryos. P = 0.0304; unpaired t test. (K) Density plot of the distance to nearest neighbor for Nanog to Pol II pSer5 particles in DMSO- and α-amanitin–treated embryos. n = 221,335 and 229,706 distances, respectively. P < 0.001; Mann-Whitney U test. (L) Histogram showing the number of Pol II pSer5 particles within 200 nm of each Nanog particle in DMSO- and α-amanitin–treated embryos. P < 0.001; Mann-Whitney U test. (M) Line plot showing Pol II pSer5 binding across gene bodies ±2 kb at zygotic genes in wild-type (WT) and α-amanitin–treated embryos. TES, transcription end site TSS, transcription start site. (N) Representative genome tracks of pan-Pol II, Pol II pSer5, and Nanog binding showing accumulation of Pol II pSer5 at the promoter and Nanog-bound enhancers in the presence of α-amanitin. (O) Heatmaps showing Pol II pSer5 binding at Nanog-bound accessible regions in WT and α-amanitin–treated embryos. Regions are ranked by Nanog ChIP-seq signal. (P) Schematic showing the kiss-and-kick model. |