|
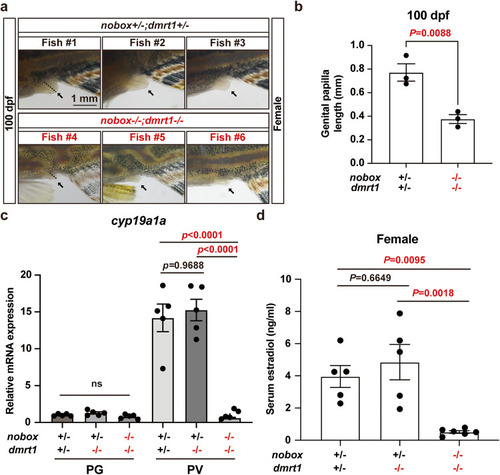
Evidence for estrogen deficiency in double mutant females. a Genital papilla in the control (nobox+/−;dmrt1+/−; n = 3 independent fish) and double mutant (nobox−/−;dmrt1−/−; n = 3 independent fish) females (arrow). The dotted line showed the length of the genital papilla. b Length of genital papilla in the controls and double mutant females (n = 3 independent fish). Data shown are mean ± SEM (P = 0.0088 by unpaired Student’s two-tailed t test). c Expression of cyp19a1a in PG and PV follicles (n = 5 independent samples). Total RNA was extracted from the isolated PG and PV follicles and reverse transcribed into cDNA for real-time PCR analysis. Each data point represents PG or PV follicles isolated and pooled from two fish for each genotype. Data shown are mean ± SEM, P values revealed by one-way ANOVA and Tukey’s test. d Serum E2 levels in the control (nobox+/−;dmrt1+/−; n = 5 independent fish), dmrt1 single mutant (nobox+/−;dmrt1−/−; n =5 independent fish) and double mutant (nobox−/−; dmrt1−/−; n = 6 independent fish) females at 100 dpf. Data shown are mean ± SEM (nobox+/−;dmrt1+/− v.s nobox+/−;dmrt1−/−: P = 0.6649; nobox+/−;dmrt1+/− v.s nobox−/−;dmrt1−/−: P = 0.0095; nobox+/−;dmrt1−/− v.s nobox−/−;dmrt1−/−: P = 0.0018; P values revealed by one-way ANOVA and Tukey’s test).
|