IMAGE

Fig. 4

ID
ZDB-IMAGE-231124-4
Source
Figures for Wu et al., 2023
Image
Figure Caption

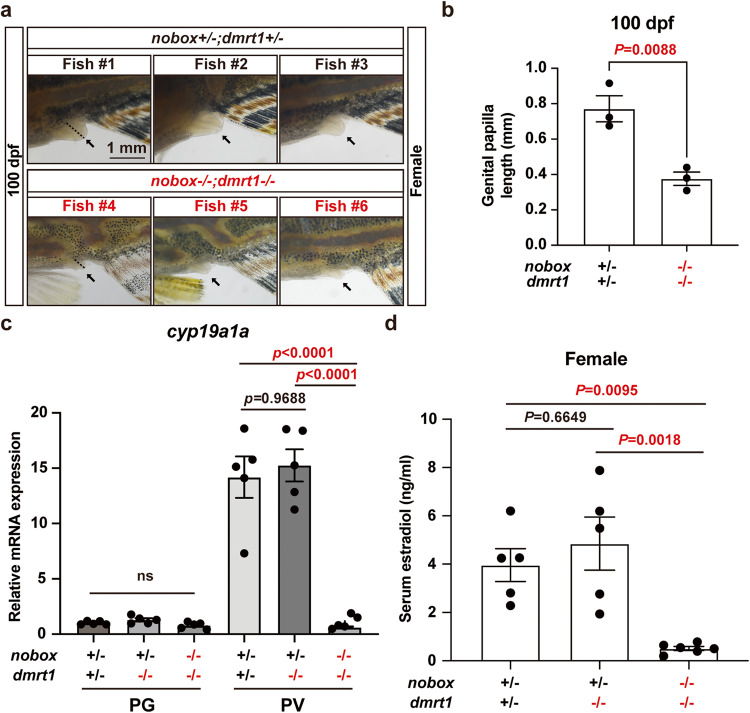
Fig. 4 Evidence for estrogen deficiency in double mutant females.

a Genital papilla in the control (nobox+/−;dmrt1+/−; n = 3 independent fish) and double mutant (nobox−/−;dmrt1−/−; n = 3 independent fish) females (arrow). The dotted line showed the length of the genital papilla. b Length of genital papilla in the controls and double mutant females (n = 3 independent fish). Data shown are mean ± SEM (P = 0.0088 by unpaired Student’s two-tailed t test). c Expression of cyp19a1a in PG and PV follicles (n = 5 independent samples). Total RNA was extracted from the isolated PG and PV follicles and reverse transcribed into cDNA for real-time PCR analysis. Each data point represents PG or PV follicles isolated and pooled from two fish for each genotype. Data shown are mean ± SEM, P values revealed by one-way ANOVA and Tukey’s test. d Serum E2 levels in the control (nobox+/−;dmrt1+/−; n = 5 independent fish), dmrt1 single mutant (nobox+/−;dmrt1−/−; n =5 independent fish) and double mutant (nobox−/−; dmrt1−/−; n = 6 independent fish) females at 100 dpf. Data shown are mean ± SEM (nobox+/−;dmrt1+/− v.s nobox+/−;dmrt1−/−: P = 0.6649; nobox+/−;dmrt1+/− v.s nobox−/−;dmrt1−/−: P = 0.0095; nobox+/−;dmrt1−/− v.s nobox−/−;dmrt1−/−: P = 0.0018; P values revealed by one-way ANOVA and Tukey’s test).

Acknowledgments
This image is the copyrighted work of the attributed author or publisher, and ZFIN has permission only to display this image to its users. Additional permissions should be obtained from the applicable author or publisher of the image. Full text @ Commun Biol