
FIGURE
Fig. 3
- ID
- ZDB-FIG-231121-68
- Publication
- Lescouzères et al., 2023 - A multilevel screening pipeline in zebrafish identifies therapeutic drugs for GAN
- Other Figures
- All Figure Page
- Back to All Figure Page
Fig. 3
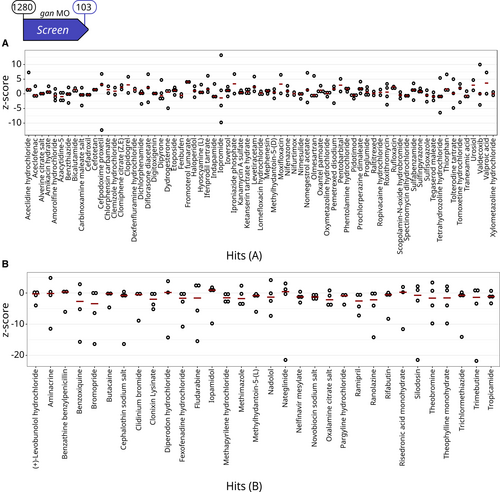
Primary Screen identifies 103 compounds restoring locomotion defects in the gan MO-injected zebrafish A, B. Single z-scores, comparing the total distance traveled by quadruplicate gan fish over 1-h period are plotted for the 71 A Hits (A) and the 32 B Hits (B). Data information: For each compound, circles represent individual larvae (n = 4 per drug) and red lines show the median z-scores (see Fig EV2 for results on the whole library). |
Expression Data
Expression Detail
Antibody Labeling
Phenotype Data
Phenotype Detail
Acknowledgments
This image is the copyrighted work of the attributed author or publisher, and
ZFIN has permission only to display this image to its users.
Additional permissions should be obtained from the applicable author or publisher of the image.
Full text @ EMBO Mol. Med.