
Fig. 2
- ID
- ZDB-FIG-231113-46
- Publication
- Radenkovic et al., 2023 - Tracer metabolomics reveals the role of aldose reductase in glycosylation
- Other Figures
- All Figure Page
- Back to All Figure Page
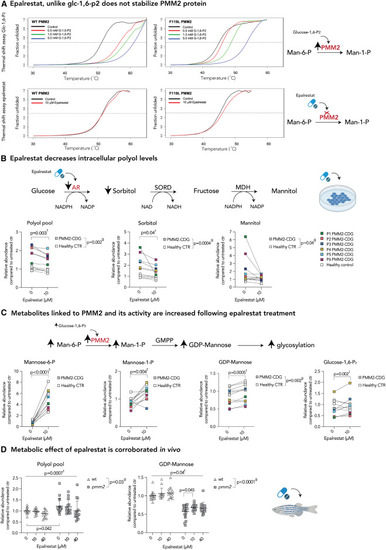
AR inhibition with epalrestat decreases polyol levels and elicits global metabolic changes in both PMM2-CDG and healthy controls (A) Epalrestat, unlike glucose-1,6-P2, does not stabilize PMM2 protein. Heat-induced melting profiles of WT human PMM2 (top panels) and the mutant (F119L HOM variant, bottom panels) recorded by thermal shift. T0.5 (50% unfolded protein) is indicated by dashed line. As previously reported, mutant protein shows lower T0.5, indicating it is less stable than WT. WT PMM2 and the F119L variant with varying concentrations of the known activator glc-1,6-P2, showing increased T0.5 with increasing ligand concentration (left panels) indicating protein stabilization. WT PMM2 and the F119L variant with epalrestat, showing less than 1.0°C change in T0.5 (right panels), indicating no effect of epalrestat on PMM2 stability. T0.5 values are provided in Table S1. (B) Epalrestat decreases intracellular polyol levels. Polyol pathway with major enzymes and cofactors is shown (top). PMM2-CDG and healthy fibroblasts were treated with 10 μM epalrestat. LC/MS analysis showed a significant effect of epalrestat on overall polyol pool (sorbitol, mannitol, galactitol). GC/MS analysis identified sorbitol as the main polyol being decreased by epalrestat, while mannitol was fluctuating (bottom). (C) Metabolite abundances linked to PMM2 enzyme are increased upon epalrestat supplementation. GDP-mannose synthesis pathway with major enzymes (PMM2) and metabolites is shown (top). Epalrestat had a significant effect on the abundances of Man-1-P, Man-6-P, GDP-mannose, and Glc-1,6-P2 in patient fibroblasts (bottom). (D) Metabolic effect of epalrestat is corroborated in vivo.Pmm2 mutant and wild-type zebrafish were treated with 10 or 40 μM epalrestat for 24 h. Asterisk (∗) indicates that each zebrafish sample contains 10 zebrafish. All metabolite abundances are represented as relative to the untreated control samples. The number of biological (n) and technical (t) replicates is PMM2-CDG n = 6, t = 2–4, CTR n = 5, t = 1–4 (B and C), and Pmm2 mutant (n = 12–16∗, t = 1) and wild-type (n = 14–19∗,t = 1) (D). Means are represented with SD. Two-way ANOVA or mixed-effects model with repeated measures was used for statistical analysis where applicable. For additional metabolites, see Figure S2. CTR, control; MDH, mannitol dehydrogenase; NAD(H), nicotinamide adenine dinucleotide (hydrogen); NADP(H), nicotinamide adenine dinucleotide phosphate (hydrogen); PMM2, phosphomannomutase-2; P, patient; SORD, sorbitol dehydrogenase; g, p value reflecting the effect of genotype; t, p value reflecting the effect of the treatment; i, p value reflecting the interaction between treatment and genotype as calculated by statistical analysis. |