
- Title
-
Tracer metabolomics reveals the role of aldose reductase in glycosylation
- Authors
- Radenkovic, S., Ligezka, A.N., Mokashi, S.S., Driesen, K., Dukes-Rimsky, L., Preston, G., Owuocha, L.F., Sabbagh, L., Mousa, J., Lam, C., Edmondson, A., Larson, A., Schultz, M., Vermeersch, P., Cassiman, D., Witters, P., Beamer, L.J., Kozicz, T., Flanagan-Steet, H., Ghesqui�re, B., Morava, E.
- Source
- Full text @ Cell Rep Med
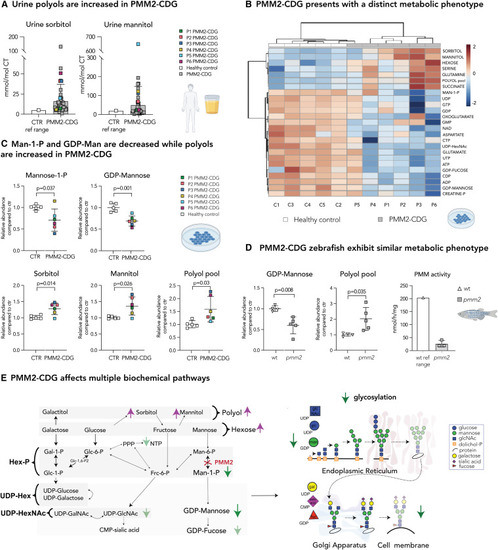
Disturbed polyol metabolism is a hallmark of PMM2-CDG (A) Urine sorbitol and mannitol are increased in PMM2-CDG G. Urine sorbitol and mannitol were measured in PMM2-CDG patients (n = 50). Higher limit of the control reference range (n = 533; sorbitol <5 mmol/mol creatine; mannitol 20 mmol/mol creatine) is given on the left. (B) Heatmap of the 25 top discriminating intracellular metabolites. Metabolomics analysis showed PMM2-CDG fibroblasts clustered separately from healthy control due to significant differences in relative abundances of multiple metabolites in PMM2 deficient fibroblasts compared with healthy controls. Clustering result shown as heatmap (distance measured using Euclidean), and clustering algorithm using Ward. (C) Mannose-1-P and GDP-mannose are depleted in PMM2-CDG fibroblasts, while intracellular polyols (sorbitol and mannitol) are increased. GDP-mannose and polyol pool (total pool of sorbitol, mannitol, galactitol) measured by LC/MS. Mannose-1-P, sorbitol, and mannitol were measured separately by gas chromatography-mass spectrometry (GC/MS). CTR, healthy control. (D) Zebrafish model of PMM2-CDG shows similar metabolic changes to PMM2-CDG fibroblasts. GDP-mannose is significantly lower in pmm2 mutant zebrafish compared with the wild-type (WT) controls, while polyols are increased. PMM enzymatic activity measured in pmm2 mutant zebrafish (n = 3). Average pmm activity of WT is given on the left. Each technical replicate contained 10 zebrafish. (E) PMM2-CDG affects multiple biochemical pathways. Representation of main findings identified by metabolomic profiling of PMM2-CDG fibroblasts and zebrafish. All metabolite abundances are represented as relative compared with the control samples. The number of biological (n) and technical (t) replicates is PMM2-CDG (n = 6, t = 1?8) and CTR fibroblasts (n = 5, t = 1?6) (B and C), pmm2 mutant (n = 5, t = 1), WT (n = 4, t = 1) (D). Means are represented with SD. Student?s t test was performed. Polyol refers to six-carbon-sugar alcohol (galactitol, mannitol, and sorbitol) pool measured by LC/MS. Hexose refers to six-carbon-sugar (glucose, galactose, fructose, and mannose) pool measured by LC/MS. UDP-hexose (UDP-hex) refers to the pool of UDP-galactose and UDP-glucose. UDP-hexNAc refers to the pool of UDP-glcNac, UDP-galNac, and UDP-manNac. C1-5, control 1?5; P, phosphate; P1?6, patient 1?6; ref range, reference range. |
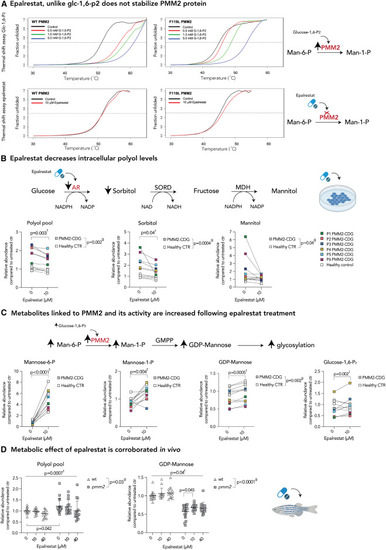
AR inhibition with epalrestat decreases polyol levels and elicits global metabolic changes in both PMM2-CDG and healthy controls (A) Epalrestat, unlike glucose-1,6-P2, does not stabilize PMM2 protein. Heat-induced melting profiles of WT human PMM2 (top panels) and the mutant (F119L HOM variant, bottom panels) recorded by thermal shift. T0.5 (50% unfolded protein) is indicated by dashed line. As previously reported, mutant protein shows lower T0.5, indicating it is less stable than WT. WT PMM2 and the F119L variant with varying concentrations of the known activator glc-1,6-P2, showing increased T0.5 with increasing ligand concentration (left panels) indicating protein stabilization. WT PMM2 and the F119L variant with epalrestat, showing less than 1.0�C change in T0.5 (right panels), indicating no effect of epalrestat on PMM2 stability. T0.5 values are provided in Table S1. (B) Epalrestat decreases intracellular polyol levels. Polyol pathway with major enzymes and cofactors is shown (top). PMM2-CDG and healthy fibroblasts were treated with 10 ?M epalrestat. LC/MS analysis showed a significant effect of epalrestat on overall polyol pool (sorbitol, mannitol, galactitol). GC/MS analysis identified sorbitol as the main polyol being decreased by epalrestat, while mannitol was fluctuating (bottom). (C) Metabolite abundances linked to PMM2 enzyme are increased upon epalrestat supplementation. GDP-mannose synthesis pathway with major enzymes (PMM2) and metabolites is shown (top). Epalrestat had a significant effect on the abundances of Man-1-P, Man-6-P, GDP-mannose, and Glc-1,6-P2 in patient fibroblasts (bottom). (D) Metabolic effect of epalrestat is corroborated in vivo.Pmm2 mutant and wild-type zebrafish were treated with 10 or 40 ?M epalrestat for 24 h. Asterisk (?) indicates that each zebrafish sample contains 10 zebrafish. All metabolite abundances are represented as relative to the untreated control samples. The number of biological (n) and technical (t) replicates is PMM2-CDG n = 6, t = 2?4, CTR n = 5, t = 1?4 (B and C), and Pmm2 mutant (n = 12?16?, t = 1) and wild-type (n = 14?19?,t = 1) (D). Means are represented with SD. Two-way ANOVA or mixed-effects model with repeated measures was used for statistical analysis where applicable. For additional metabolites, see Figure S2. CTR, control; MDH, mannitol dehydrogenase; NAD(H), nicotinamide adenine dinucleotide (hydrogen); NADP(H), nicotinamide adenine dinucleotide phosphate (hydrogen); PMM2, phosphomannomutase-2; P, patient; SORD, sorbitol dehydrogenase; g, p value reflecting the effect of genotype; t, p value reflecting the effect of the treatment; i, p value reflecting the interaction between treatment and genotype as calculated by statistical analysis. |
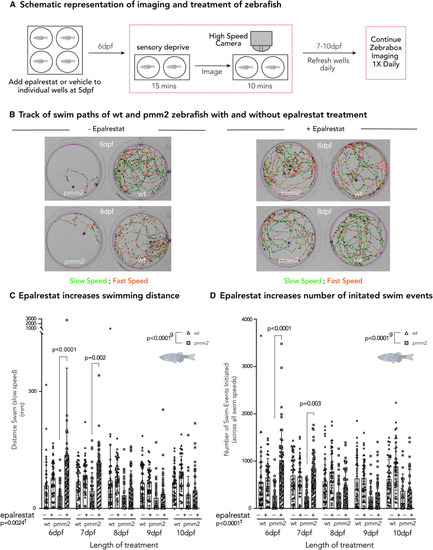
Effects of aldose inhibition are corroborated in vivo in pmm2 mutant zebrafish (A) Schematic representation of imaging and treatment of zebrafish. Briefly, 5-dpf wild-type and pmm2 embryos were placed one per well in a 12-well culture dish and treated daily with either 20 ?M epalrestat or vehicle, refreshing the media daily. After 15 min of sensory deprivation, locomotor activity is monitored for 10-min intervals each day (6?10 dpf) using the Zebrabox system. (B) Track of swim paths of wild-type and pmm2 zebrafish with and without epalrestat treatment on 6 and 8 dpf. Slow speed is indicated in green, while fast speed is indicated in red. (C) Epalrestat increases swimming distance (mm). Epalrestat significantly increased swimming distance at 6 and 7 dpf in pmm2 mutant zebrafish. (D) Epalrestat increases number of initiated swim events. Epalrestat significantly increased the number of initiated swim events. Mixed-effect analysis with repeated measures was used to statistically evaluate data. Means are represented with SD. e, p value reflecting the effect of epalrestat treatment; lt, p value reflecting the length of treatment; g, p value reflecting the effect of genotype calculated by statistical analysis. The number of biological (n) and technical (t) replicates was wild-type, n = 42?46, t = 1; pmm2, n = 22?51, t = 1. |

Tracer studies with 13C6 glucose upon AKR1B1 siRNA inhibition reveal metabolic rewiring and increased de novo sugar nucleotide synthesis (A) Methodology. To assess the changes in glucose flux in AKR1B1 KD cells, cells were incubated with either siRNA targeting the AR gene AKR1B1 or non-targeting (negative) siRNA for 48 h. Then, medium was changed and the medium containing either 13C6-glucose (tracer glucose) or 12C6-glucose was added. Tracer was then metabolized throughout subsequent biochemical pathways. Metabolites were extracted for metabolomics analysis. Furthermore, membrane-bound sialic acid, the end sugar of glycan chains, was isolated and subjected to metabolomics analysis. (B) AKR1B1 KD results in a decrease in polyols and increase in metabolites related to glycosylation. Relative polyol abundances and FC of 13C6 glucose in polyol were decreased following AR KD, while UDP-hexose and CMP-sialic acid abundances were increased. (C) Deconvolution of positional labeling of 13C6 glucose in CMP-sialic acid. Increase in m11, m14, and m16 after AR inhibition and incubation with 13C6 glucose in CMP-sialic acid indicates multiple pathways (PPP, nucleotide biosynthesis, glucosamine biosynthesis, and glycolysis) are simultaneously upregulated upon AR inhibition. (D) Increased glucose flux is observed in membrane-derived sialic acid, terminal glycan sugar. Increase in abundance and FC of 13C6-glucose in cytosolic sialic acid is observed in cells treated with siRNA targeting AKR1B1 (see Figure S4B). These changes ultimately lead to increase in abundance and FC of 13C6-glucose in CMP-sialic acid and sialic acid derived from membranes, suggesting that sialylation and overall glycosylation are improved upon AR inhibition. Relative metabolite abundances were calculated based on the average of CTR treated with non-targeting (negative) siRNA. FC of 13C6 glucose was calculated for each metabolite based on the isotopologue distribution and corrected for naturally occurring 13C isotopes (see STAR Methods). Two-way repeated-measures ANOVA or mixed-effect analysis with repeated-measures analysis were performed. For the additional metabolites, see Figure S4B. Specific relative metabolite abundances in PMM2-CDG and CTR and %FC can be found in Figure S4B. The number of biological (n) and technical (t) replicates: PMM2-CDG n = 2, t = 3; healthy control n = 3, t = 1?3 (B and C); PMM2-CDG n = 2, t = 2; healthy control n = 2, t = 2 (D). The artworks are a visual representation of the results, where the size of the pies represents the arbitrary abundance of represented metabolites across both CTR and PMM2-CDG, while the color of the pie represents the average %FC of 13C6-glucose in the specific metabolite. FC, fractional contribution; negat siRNA, negative/non-targeting siRNA; AKR1B1 siRNA, siRNA targeting ARK1B1 gene; CTR, control; P, patient; g, p value reflecting effect of genotype; s, p value reflecting the effect of the siRNA targeting AKR1B1; i, p value reflecting the interaction between AKR1B1 KD and positional labeling. |