
Fig. 1
- ID
- ZDB-FIG-231113-45
- Publication
- Radenkovic et al., 2023 - Tracer metabolomics reveals the role of aldose reductase in glycosylation
- Other Figures
- All Figure Page
- Back to All Figure Page
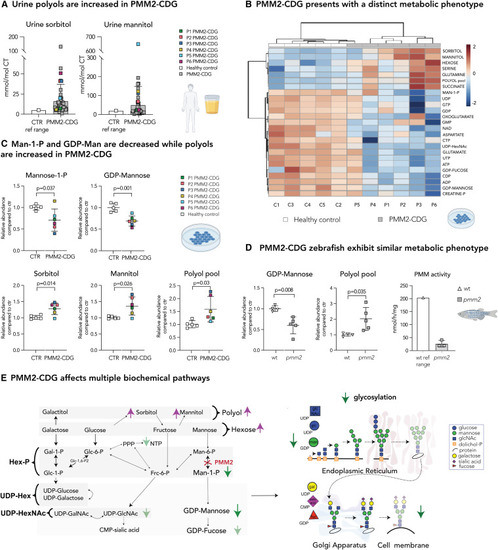
Disturbed polyol metabolism is a hallmark of PMM2-CDG (A) Urine sorbitol and mannitol are increased in PMM2-CDG G. Urine sorbitol and mannitol were measured in PMM2-CDG patients (n = 50). Higher limit of the control reference range (n = 533; sorbitol <5 mmol/mol creatine; mannitol 20 mmol/mol creatine) is given on the left. (B) Heatmap of the 25 top discriminating intracellular metabolites. Metabolomics analysis showed PMM2-CDG fibroblasts clustered separately from healthy control due to significant differences in relative abundances of multiple metabolites in PMM2 deficient fibroblasts compared with healthy controls. Clustering result shown as heatmap (distance measured using Euclidean), and clustering algorithm using Ward. (C) Mannose-1-P and GDP-mannose are depleted in PMM2-CDG fibroblasts, while intracellular polyols (sorbitol and mannitol) are increased. GDP-mannose and polyol pool (total pool of sorbitol, mannitol, galactitol) measured by LC/MS. Mannose-1-P, sorbitol, and mannitol were measured separately by gas chromatography-mass spectrometry (GC/MS). CTR, healthy control. (D) Zebrafish model of PMM2-CDG shows similar metabolic changes to PMM2-CDG fibroblasts. GDP-mannose is significantly lower in pmm2 mutant zebrafish compared with the wild-type (WT) controls, while polyols are increased. PMM enzymatic activity measured in pmm2 mutant zebrafish (n = 3). Average pmm activity of WT is given on the left. Each technical replicate contained 10 zebrafish. (E) PMM2-CDG affects multiple biochemical pathways. Representation of main findings identified by metabolomic profiling of PMM2-CDG fibroblasts and zebrafish. All metabolite abundances are represented as relative compared with the control samples. The number of biological (n) and technical (t) replicates is PMM2-CDG (n = 6, t = 1–8) and CTR fibroblasts (n = 5, t = 1–6) (B and C), pmm2 mutant (n = 5, t = 1), WT (n = 4, t = 1) (D). Means are represented with SD. Student’s t test was performed. Polyol refers to six-carbon-sugar alcohol (galactitol, mannitol, and sorbitol) pool measured by LC/MS. Hexose refers to six-carbon-sugar (glucose, galactose, fructose, and mannose) pool measured by LC/MS. UDP-hexose (UDP-hex) refers to the pool of UDP-galactose and UDP-glucose. UDP-hexNAc refers to the pool of UDP-glcNac, UDP-galNac, and UDP-manNac. C1-5, control 1–5; P, phosphate; P1–6, patient 1–6; ref range, reference range. |